Laboratory Report
Activity:
Effect of Exercise on Arterial Pressure and Vascular Resistance
Predictions
Exercise will cause MAP to
increase
Exercise will cause systemic vascular resistance to
decrease
Exercise will cause CO to
increase
Materials and Methods
Dependent Variable HR, SV, BP
Independent Variable level of activity
Controlled Variables gender age
Identify one variable that was not controlled in this study (not dependent or independent variables; hint: think about possible differences between subjects).
Race
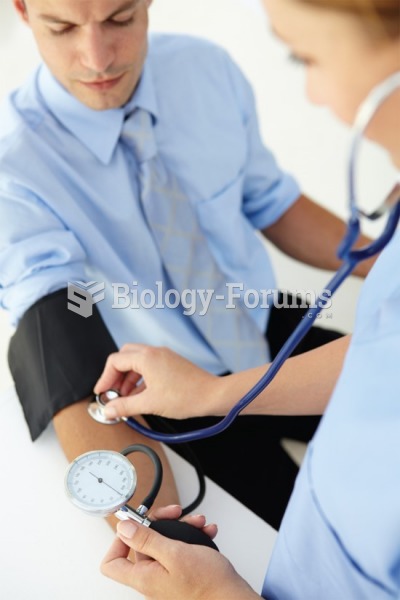
SVR was calculated using values for BP, CO, and HR. What instrument was used to measure each of the following.
Blood pressure - Blood pressure Sphygmomanometer
Cardiac output - Cardiac output 3D imaging
Heart rate - Heart rate ECG
Results
Effect of Exercise on Systolic and Diastolic Blood Pressure (SBP, SDP), Heart Rate (HR) and Stroke Volume (SV)
Resting Values Immediately After exercise
Systolic BP
(mmHg) Diastolic BP
(mmHg) HR
(beats/min) SV(L) Systolic BP
(mmHg) Diastolic BP
(mmHg) HR
(beats/min) SV(L)
Subject 1 125 81 74 0.075 150 83 147 0.107
Subject 2 124 80 74 0.077 145 83 146 0.106
Subject 3 123 85 72 0.08 146 81 147 0.11
Averages 124 82 73 0.077 147 82 147 0.108
Resting and exercising systolic BP-
What was the average resting systolic BP? 122
What was the average exercising systolic BP? 148
The range of normal resting systolic BP for the subjects in this experiment is 115-125 mmHg. Did systolic BP increase, decrease, or not change with exercise? Increase
Resting and exercising diastolic BP —
What was the average resting diastolic BP? 83
What was the average exercising systolic BP? 84
The range of normal resting diastolic BP for these patients was 75-85 mmHg. Did diastolic BP increase, decrease, or not change with exercise? Increase
Resting and Exercising MAP —
What was the average resting MAP? 96
What was the average exercising MAP? 104
The range of normal resting MAP for the subjects in this experiment is 88-98 mmHg. Did MAP increase, decrease, or not change with exercise? increased
Resting and Exercising CO —
What was the average resting CO? 5.7
What was the average exercising CO? 15.8
The range of resting CO for the subjects in this experiment is 4.55-5.55 L/min. Did CO increase, decrease, or not change with exercise? Increased
Resting and Exercising SVR —
What was the average resting SVR? 16.8
What was the average exercising SVR? 6.6
The range of resting SVR for the subjects in this experiment is 10.2-12.03 mmHg per min/L. Did SVR increase, decrease, or not change with exercise? Decrease
Discussion
Explain what caused the observed changes in systolic BP and MAP with exercise.
Compare the resting and exercising systemic vascular resistance values and discuss what causes the observed change with exercise.
Explain how the change in MAP and SVR affected blood flow and why this is important.
Restate your predictions that were correct and give data from your experiment that support them. Restate your predictions that were not correct and correct them with supporting data from your experiment.
Application
Calcium channel blockers, a type of anti-hypertensive drug, block the entry of calcium into smooth muscle which causes smooth muscle to relax. Explain how this decreases blood pressure.
Explain why cutting an arterial vessel will cause a greater loss of blood over the same amount of time than cutting a venous vessel.
ANY HELP WITH THE DISCUSSION AND APPLICATION QUESTIONS WOULD BE GREATLY APPRECIATED
 Quick Reply