Transcript
Monday 1/7 am
Pre-Term
BLS ~ Bureau of Labor Statistics
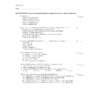
Current Numbers “Good” Numbers
GDP Growth 3.4% 3%
Inflation Rate 2.2% 2%
Unemployment 3.9% 5%
Business Cycle
90506822922273711870601
Real GDP When there is an increase there is Expansion
When there is a decrease there is Recession
(Contraction)
746449231892
Time
Expansion ~ The economy is doing better and there is growth that benefits the nation
Recession (Contraction) ~ The economy is doing bad and there is no benefits in the nation
You want the economy to be like a Ferris Wheel
Monetary and Fiscal Policy
We want to use these tools to measure the economy
Section 1
GDP
GDP Definition
Circular Flow Model
How it is calculated (& Limitations)
Expenditure Method
Real vs. Nominal
GDP/GDP per capita
Business Cycle
Potential GDP
GDP Definition ~ GDP (Gross Domestic Product) is measured in dollar terms, we need to know quantity and the market value that is based on price of all “final” goods and services produced domestically within the nation ’s boarders in a given year; sometimes quarterly.
Example ~ Right now the GDP of the USA is $18 Trillion whereas Europe is $17 Trillion
The Circular Flow Model
‘Y’ is Income, money earned
‘NT’ is Net Taxes
‘S’ is Savings, money that isn’t spent on consumptions or taxes
‘C’ is Consumption, products or services purchased to be used
‘I’ is Investment, Businesses investing to grow their business
‘G’ is Government Spending on goods and services
‘NX’ is Net Exports from other countries
(Exports-Imports)
How is it Calculated?
$18 Trillion (real)
$20.7 Trillion (nominal)
Income Approach ~ Y = NT + S + C
*Expenditure Approach ~ C + I + G + NX = GDP*
8880426506800
GDP = C + I + G + NX
Bureau of Economic Analysis
Includes: Goods/Services produced by foreign companies in the U.S.
Excludes: U.S. owned companies’ production overseas, purchases of stocks and bonds, used goods, intermediate goods, household production, & illegal goods/services
Measured Quarterly
Data is compiled and distributed a while after that quarter had ended
1st Quarter ~ Jan.- March
2nd Quarter ~ April - June
3rd Quarter ~ July- Sept.
4th Quarter ~ Oct. – Dec.
When……..
Wages go up ? Demand goes up ? Prices go up
Wages necessarily do not go up when inflation increases
GDP vs. GDP per capita
USA Nominal GDP = 20.7 T330 M
USA Nominal GDP per capita = $62,727 Standard of living
China Nominal GDP = 20.7 T 1.6 B
China Nominal GDP per capita = $12,937
Country Comparisons
Country GDP (Trillion) GDP Growth GDP per capita HDI
A $3.8 1.5% $47,000 .916 (6th)
B $3.5 -5.3% $23,700 .798 (50th)
C $3.2 -3.0% $15,800 .755 (75th)
D $2.8 4.7% $11,300 .684 (110th)
E $2.7 2.5% $41,200 .907 (14th)
F $2.2 2.3% $18,500 .756 (74th)
G $1.6 1.0% $45,900 .913 (9th)
H $1.6 3.0% $20,500 .761 (72nd)
HDI ~ Human Development Index
Question ~ Does a higher GDP or GDP per capita mean that there is a better standard of living in that country?
Answer ~ With having a higher GDP or GDP per capita does not mean that there is a better standard of living. The two are possibly correlated but they may not be causable, that means that they might not directly affect the standard of living. The idea of having a better way of life in the nation means that everyone is thriving and there are underlying factors that affect the way of life; the government, natural disasters, location, etc. Just by looking at the table above we see how they could be correlated but they will not be causable with each other.
Real vs. Nominal
Nominal GDP ~ Measured using current year/specific year prices, will change if price and/or quantity change
Real GDP ~ Measured using a base year price(BEA uses 2009); real GDP is adjusted for inflation, will only change if quantity changes
‘Nominal’ tends to be greater then ‘Real’ because ‘Nominal’ will either increase or decrease depending on if the price and/or quantity changes; look at half sheet over ‘Nominal vs. Real’.
Potential GDP
Potential GDP ~ What we could potentially be making on our PPF (Production Possibilities Frontier) if we are being economically efficient in all aspects of that market.
The Business Cycle
Fluctuations in the pace of expansion of real GDP is called the Business Cycle
*The business cycle is a periodic, but irregular, up and down movement of total production and other measures of economic activity.*
The National Bureau of Economic Research(NBER) measure and record all of the recessions
Monday 1/7 pm
International Trade
Production Possibilities Frontier
Comparative Advantage
Benefits & Costs of Trade
Exports & Imports graphs
Protectionism
Tariffs
Exchange Rates
Production Possibilities Frontier
*Refer to handout*
PPF represents what we can produce at an efficient state or an inefficient state, or what we couldn’t produce which is outside the curve, this also shows potential GDP.
Key Economic Principles that the PPF illustrate are….
Scarcity
Efficiency – on the curve
Opportunity Cost
Growth
Absolute Advantage ~ Is the ability to produce more or better goods and services than somebody else.
Comparative Advantage ~ Is the ability to produce goods and services at a lower opportunity cost, not necessarily at a greater volume.
Costs and Benefits of Trade
Costs
More Price with lower Quantities
Dependency
Lost Jobs due to increased competition
Benefits
You gain new products/resources
Establish Diplomatic ties
Help develop countries; gain skills
More Quantity with lower Prices
Specialization
Build bigger Markets
Create Jobs
Forces innovation
Exports and Imports Graph
755650223079 Cotton (Domestic Industry)
78295597190
102636721518700 P
914400833200 CS S
909734213850076467072701 World Price
186499515449900 PS
77343026244900 Exports D
Q
With Trading Exports… Price goes up, CS goes down, PS goes up by more than CS goes down.
737118247806Sugar
62048623811200102636721518700 P
914400833200 S
186499515449900 CS
135210920764500
135293910487900825881907590082052386308 World Price
75457427114500 PS Imports D
QD QS Q
With Trading Imports… Price goes down, CS goes up, PS goes down by more than CS goes up, QD goes up, and QS goes down.
Who does the US Trade with? (Top 6)
1.Canada $322B
2.Mexico $262B
3.China $170B
4.UK $121B
5.Japan $109B
6.Germany $80B
What does the US Trade(Export)? What does the US Trade(Import)?
Capital Goods Capital Goods
Industrial Supplies Industrial Supplies
Consumer Goods Consumer Goods
Automotive Automotive
Food/Beverage Food/ Beverage
Services Services
International Trade Restrictions
Arguments for imposing trade restrictions along with their counter-arguments….
International Trade Saves Jobs
Counter ~ Protects jobs by restricting imports, so the jobs stay at home not overseas.
International Trade is an Infant Industry
Counter ~ International Trade is used by older, inefficient industries, where there is little growth in the domestic industry.
International Trade helps with our National Defense
Counter ~ Trading with multiple countries will minimize the risk of a war breaking out.
International Trade is used just for Dumping
Counter ~ Predatory pricing is a temporary; firms can re-enter when prices go up, along with foreign firms often having competitors in other countries.
Why would a government impose a tariff?
They would impose a tariff mainly because they want to raise the revenue and to protect the domestic industries from the international or foreign competition since consumers will probably buy a foreign-product which is known to be more cheaper.
How would this change price and quantity?
It would change the price of goods by going down and having a greater quantity. Since the price has increased, suppliers are willing to produce more goods so their production increases
Is it efficient to impose a tariff?
It would be efficient to impose a tariff because of the Government wanting to raise the revenue and only benefit the domestic producers, where the prices could be to high for the average person to pay.
Who are the winners and losers when a tariff is imposed?
Winners: Producers & Government
Losers: Consumers & Import Producers
What are some unintended consequences of the tariff?
Some unintended consequences would be high prices in domestic producers because of the limitations of imports. It is detrimental to the Import Producers as well.
Tuesday 1/8 am
Inflation
Definition
Inflation Rate & Deflation
Consumer Price index
“Basket of Goods”
Limitations/Biases
Calculations
Real and Nominal
Definition ~ Inflation is the general increase in prices and fall in the purchasing value of money.
What do we know about Inflation?
Inflation is mostly bad (but a little bit is OK)
It devalues your money (i.e. your purchasing power)
Purchasing power: the amount of goods/services you can buy with the same amount of money (i.e. a fixed income)
In fact, the value of money is the inverse of the price level
Inflation can get out of control, and if it does, it can be very painful to get it back under control
Hyperinflation ~ Often described as inflation > 50% per month
Inflation rate ~ The percent change in the price level from one year to the next.
To find the rate…… New-OldOld x 100
Base Year ’82-’84, & value of CPI in base year…. 100
Example ~
Jan. 2018 - 247.867
Jan. 2016 – 245.1
245.1-240240 x 100=2.13%
Ways to identify Price Level
–Consumer Price Index (CPI)
–Producer Price Index (PPI)
–Gross Domestic Product (GDP) Price Index
–Personal Consumption Expenditure (PCE) Price Index
“Basket of Goods”
On average, this how Americans spend their incomes…..
Housing……. ………..38%
Food/Beverage……….15%
Transportation………..12%
Medical Care…………9%
Education/Comm…….7%
Energy………………..7%
Recreation……………6%
Apparel……………….3%
Other………………….3%
Limitations/Biases
People don’t spend their money exactly like the “Basket of Goods”, meaning it is not 100% accurate.
“Basket of Goods” was started in 1913, so there is not an accurate depiction of the prices of today’s items, the new needs and wants of our era, and the biases we have with our era.
Biases
New Goods Bias
Quality Change Bias “Technology Bias”
Substitution Bias “Commodity Bias”
“The CPI is overstated…” which is a common saying amongst most Economist because the BLS doesn’t take into consideration the way they gather data; the biases mentioned before.
Calculations
Interest Rates
Real Interest Rate = Nominal Interest Rate- Inflation Rate
Adjusting Nominal to Real Values
Example ~
What is the highest grossing movie of all time?
‘Gone with the Wind’ $390 M in 1939
‘Avatar’ $2.7 B in 2009
CPI CPI
1939 2009
14.0 214.5
$39014.0=$x214.5
x=390214.514
x=5,975 M…$5.91 B
Tuesday 1/8 am/pm
Unemployment
How its Measured
Limitations
Discouraged Workers
Alternative Measure
Calculations: Unemployment & Labor Force Participation Rate
Types of Unemployment
The Natural Rate of Unemployment
Potential GDP
How its Measured
Unemployment Rate=UnemployedLabor Force x 100
Labor Force Participation Rate=Labor ForceWorking Age Pop.
Limitations
Not included ~ Under 16, institutionalized, or military reserve
Non-Labor Force ~ Retirees, disabled, not looking for work for more than 1 month, students, & stay at home parents
If you fall in this category then you are not unemployed but not in the Labor Force
Then you can fall into either Employed or Unemployed
Total Labor Force: 163,240,000
Employed: 156,945,000
Unemployed: 6,294,000
Counts Part-Time work as Full-Time work
Discouraged workers are not counted as unemployed
U 6 Rate=Unemployment+Marginally Effected+Part Time(For Econ. reasons) Labor Force+Marginally Effected=%
OOH ~ Occupational Outlook Handbook
Types of Unemployment
Frictional ~ Normal Labor turnover; think of it as voluntary work.
Structural ~ Loss of jobs from improvements in technology & foreign competition.
Cyclical ~ Unemployment that occurs in a recession
Seasonal ~ Your employed seasonal; lifeguard during the summer or a ski resort worker during the winter
Structure of the Economy (Labor) ~
Agriculture
Manufacturing
Services
Self-Employed
Natural Rate of Unemployment
The Natural Rate of Unemployment is about 5%
Potential GDP
GDP you could produce full employment…..
if unemployment = 5% then real GDP = Potential GDP
Tuesday 1/8 pm
Economic Growth (Long Term)
Long Term Growth
Real GDP/Person
Labor Productivity
Diminishing Marginal Return
Preconditions
Policies to Support Growth
Long Term Growth
Real GDP ~ Is used to measure economic growth (National Average)
Real GDP/Person ~ Is used to show standard of living
How do we push out the PPF rightwards?
Improve the Quantity & Quality of Labor
Quantity: Get more Labor
Quality: Increase Human Capital (Human Capital are skillful, and knowledgeable workers)
&
Improve the Quantity & Quality of Efficiency
Quantity: More Physical Capital
Quality: Technology
Labor Productivity
Labor Productivity = Output per Worker
Can also be measured as Real GDP per Labor Hour
You can Improve Productivity by……
More Physical Capital
Technology
Human Capital
Diminishing Marginal Returns
Diminishing Marginal Returns ~ The slow and inefficient increase of the marginal output as input is increased, but where marginal output is not as prominent as before the new addition of input.
Preconditions for Growth
Rule of Law (Legal System)
Property Rights
Economic Freedom
Market System
Policies to Support Growth
Public Goods ~
Provide WiFi
Infrastructure
Education
Public Safety
Grants/Subsidies
Research
Medical Advancements
Encourage Savings (IRA)…….. more investment to the community
Encourage Trade
Wednesday 1/9 pm
Section 2
Aggregate Supply & Aggregate Demand Model
Aggerate Supply Model
Influence on the Model
Shifters
Aggerate Demand Model
Influence on the Model
Shifters
Recessionary Gap
Inflationary Gap
Demand-Pull
Cost Push
Changes in Aggregate Demand
Fiscal & Monetary Policy
Influence on the Model
19776751219210
Shift the Potential GDP
Increase in Technology
Increase in Capital Increases Productivity
Increase in Physical Capital
Increase in Labor
Shift the Aggregate Supply
Price of Inputs
Anything that Shifts the Potential GDP
Aggregate Demand
Shifters
Anything that shifts C, I, G, or NX
3 Situations for Macroeconomic Equilibrium
Macro-equilibrium
Ideal Situation ~ When Aggregate Supply & Aggregate Demand intersect
86404116891000
7277885066900General PGDP
18661221537000Price Level AS
Solution?
40195501733984081111253000 AD
22855591971100
PL
1858010423510074485560519
“Current”
196875988939 AD
RGDP RGDP
RGDP > PGDP
Inflationary Gap….. Expansion Phase
2677886169713007277884841600867410-171100General PGDP
Price Level AS
4011930161731 Solution?
AD
7371181793622855591971100
PL
2668270683860073037962256
“Current”
AD
RGDP RGDP
RGDP < PGDP
Recessionary Gap….. Recession Phase