Dear all,
I would like to ask you about how to interpret a pearson correlation relationship between 2 parameters.
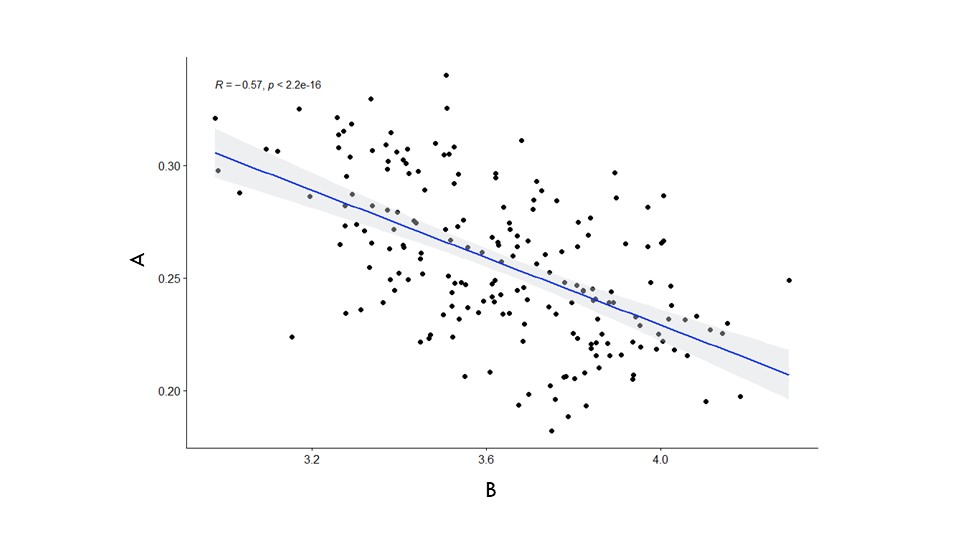
Here is the graph,
Could I interpret this as,
A and B have strong negative relationship. When A increase, b will decrease.
then how about the spreading of points? some points are close to the line and some of that are not?
Please help me!
Thank you.
|
Answer
Click to Reveal
Hi tsing_lee,
You're right, the spread is quite substantial. It looks like there is a negative correlation between the parameters, but the R value isn't strong as you suggested. According to the chart, R is -0.57, which means it is negative moderate, not strong.
According to this video, you can find the significance of the R value if you're given the raw data. But I'm assuming this graph was obtained from an article, to which they don't provide the raw data. Watch the video above to understand a little more what I mean.
|