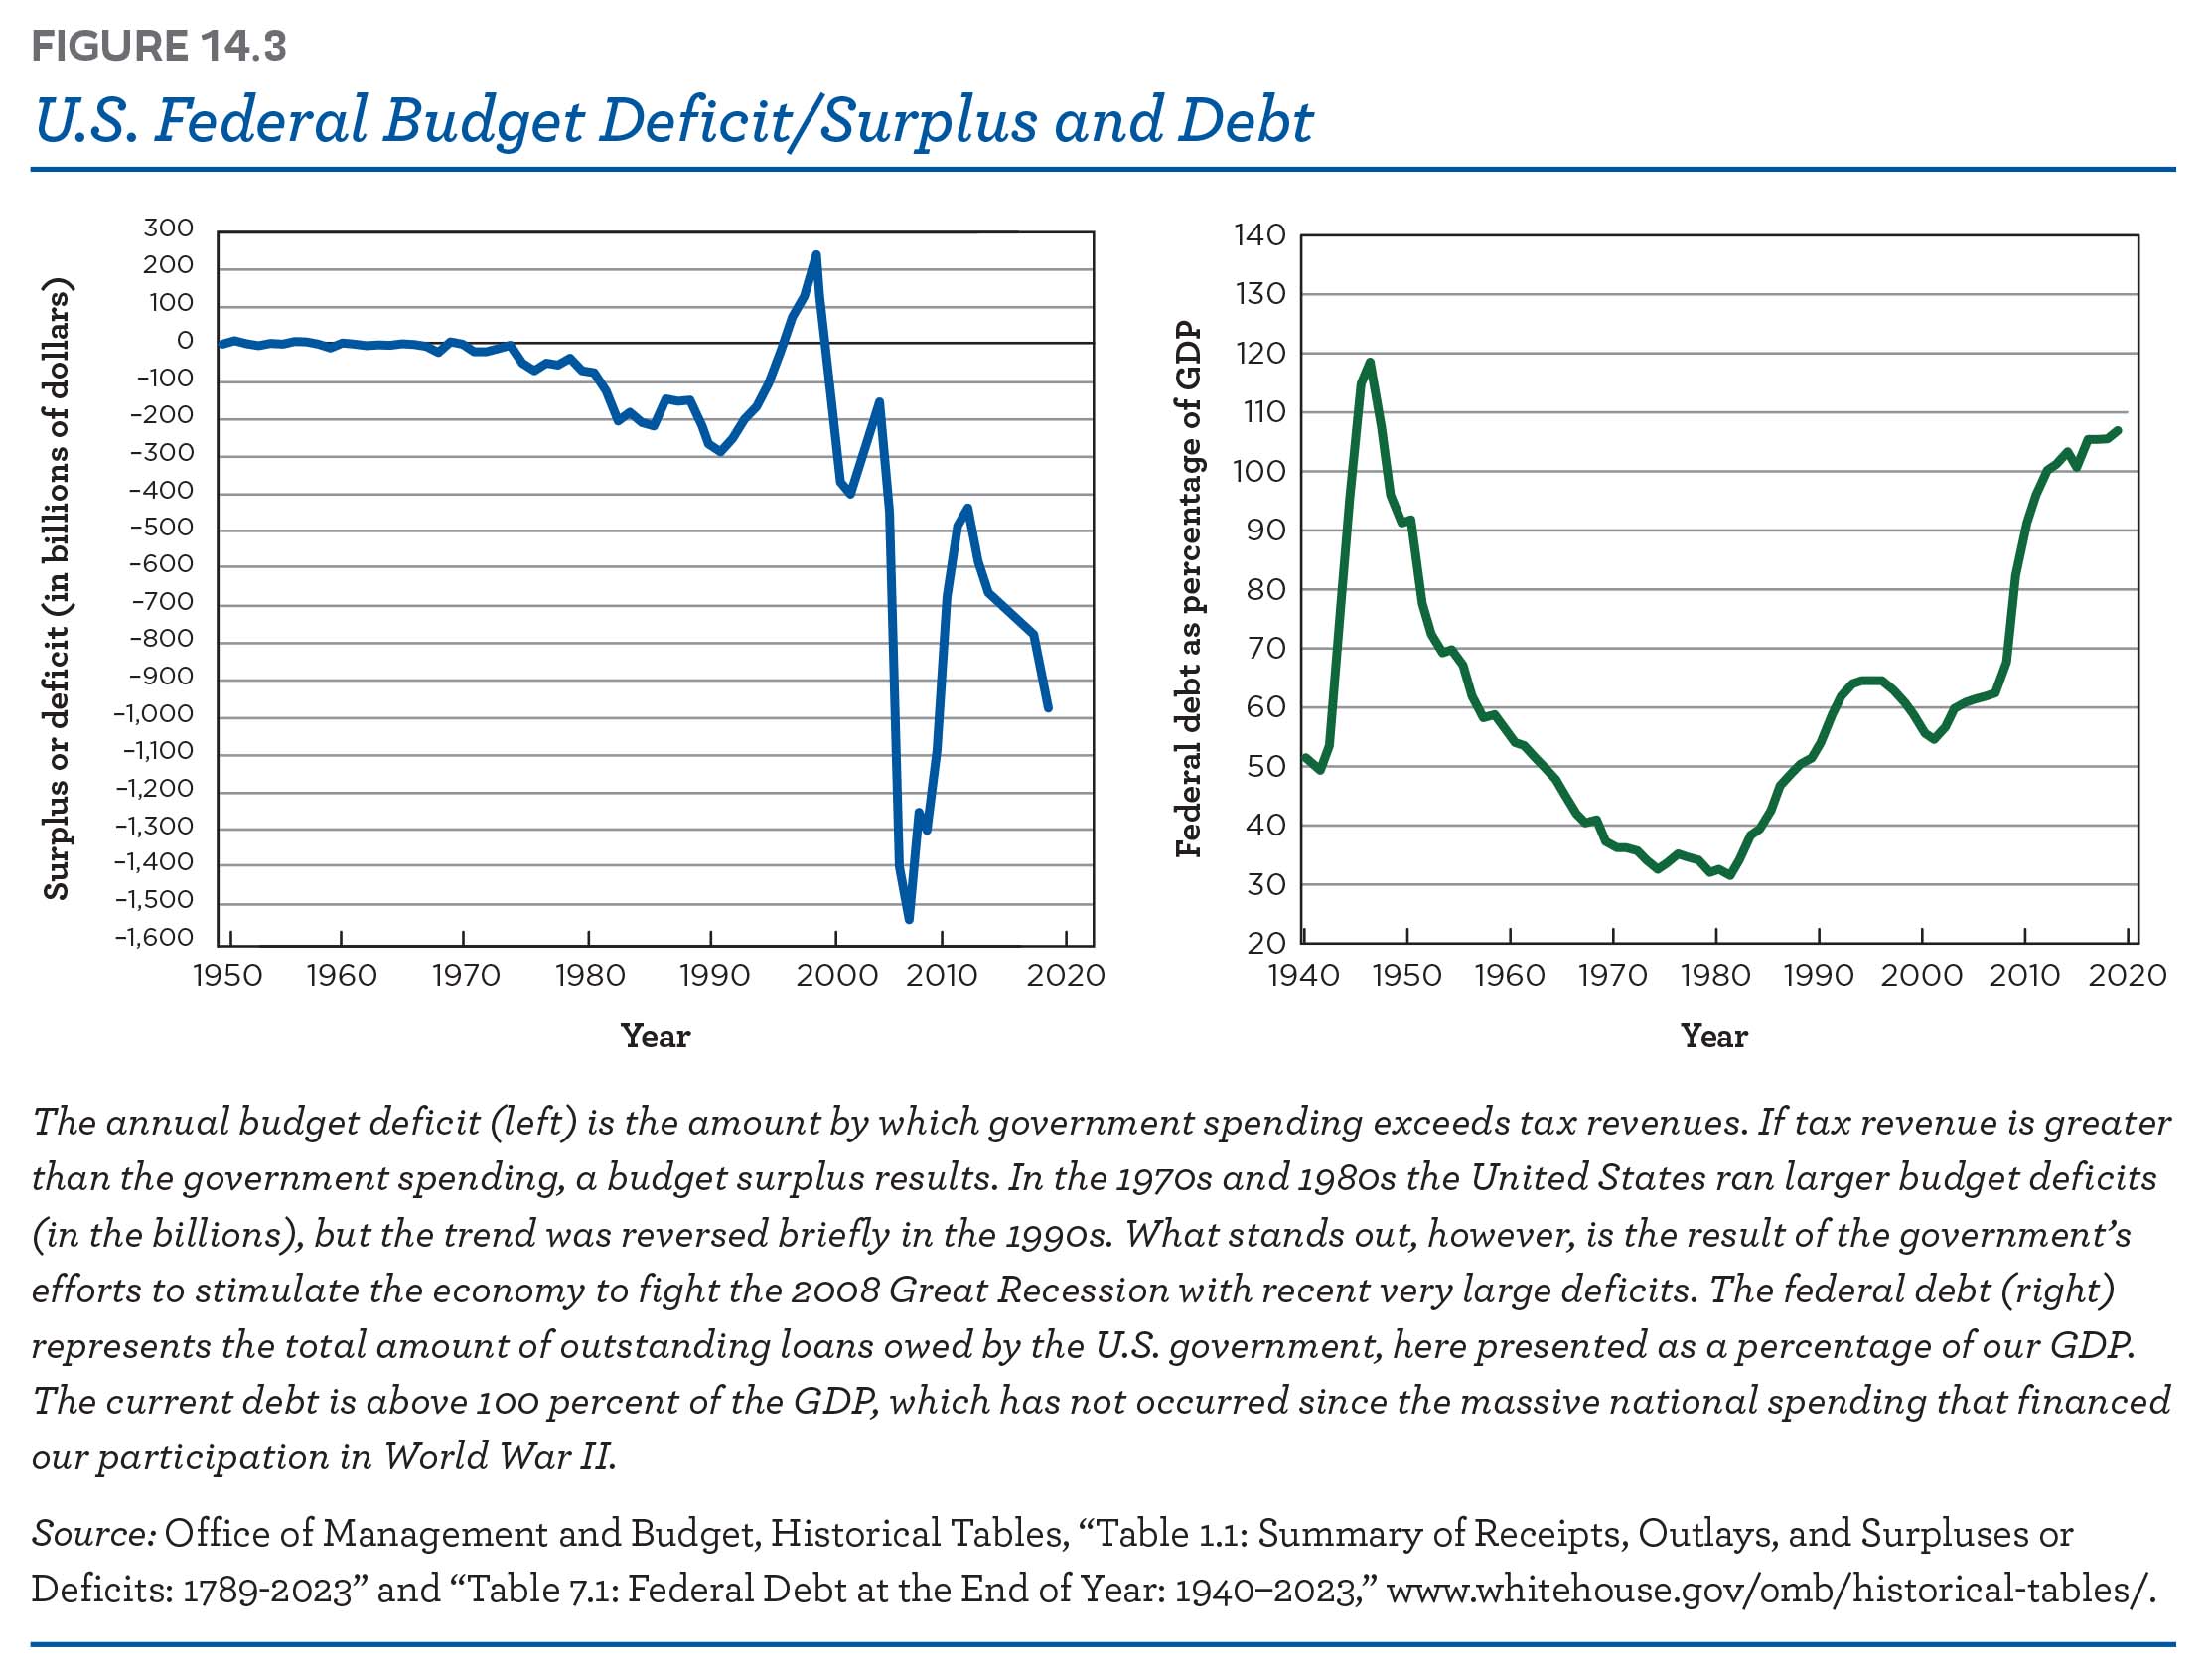
FIGURE 14.3 US. Federal Budget Deficit/Surplus and Debt 300 140 200 E 100 130 a o n. = Q 120 .g —100 0 ‘ '45 —200 ”6 110 l m —3oo 1’ U) A g —400 g 100 E —500 5 90 -: —600 2 :7, —700 8. 80 H _ (I) '8 800 a, 70 .3;- —900 5 -8 —1,000 .3 60 g —1,100 7-,, 50 3 —1,200 ’6 '3'. —1,300 '3 4O ‘5 —1,400 "" ”3 4,500 30 —1,600 20 1950 1960 1970 1980 1990 2000 2010 2020 1940 1950 1960 1970 1980 1990 2000 2010 2020 Year Year The annual budget deficit (left) is the amount by which government spending exceeds tax revenues. If tax revenue is greater than the government spending, a budget surplus results. In the 1970s and 1980s the United States ran larger budget deficits (in the billions), but the trend was reversed briefly in the 1990s. What stands out, however, is the result ofthe government’s efforts to stimulate the economy to fight the 2008 Great Recession with recent very large deficits. The federal debt (right) represents the total amount ofoutstanding loans owed by the US. government, here presented as apercentage ofour GDP. The current debt is above 100 percent of the GDP, which has not occurred since the massive national spending that financed ourparticipation in World War II. Source: Office of Management and Budget, Historical Tables, “Table 1.1: Summary of Receipts, Outlays, and Surpluses or Deficits: 1789-2023” and “Table 7.1: Federal Debt at the End of Year: 1940-2023,” wwwwhitehouse.gov/omb/historical-tables/.
Related Images
253
256
240
2305
809
613
200
294
321
Add Comment
0 Comment
Explore
Post your homework questions and get free online help from our incredible volunteers