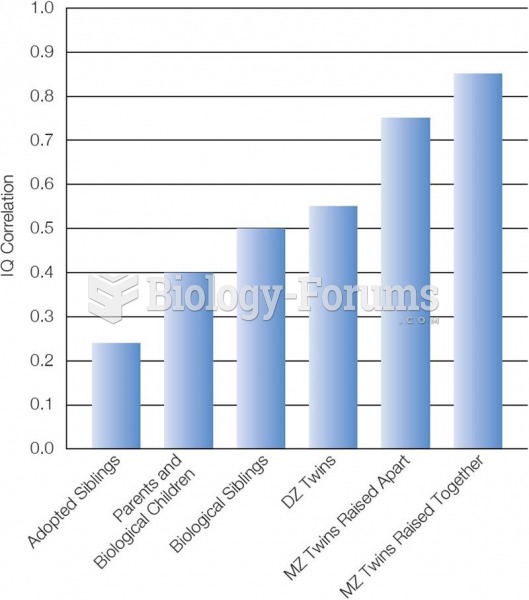
The graph that shows a correlation is called a _____.
a. simple bar graph c. scatter plot
b. clustered bar graph d. histogram
What is 17.295 rounded to one decimal place?
a. 17.1 c. 17.2
b. 17.0 d. 17.3
Which of the following pairs of variables are likely to be negatively correlated?
a. distance of a lightning strike from you and the delay between the flash and the thunder
b. number of times you have seen a movie and amount of dialogue you know by heart
c. the amount of rainfall in the past week and the depth of a nearby lake
d. the number of hours sleep you had in the past two nights and the likelihood that you will be grumpy
What are the real limits of the observation of 6.1 seconds (measured to the nearest second)?
a. 6.05-6.15 c. 6.0-6.2
b. 5.5-6.5 d. 6.00-6.20
Which of the following pairs of variables are probably positively correlated?
a. weight and IQ of a person
b. amount of time spent rehearsing material and amount learned
c. the amount of traffic in a city and the city's air quality
d. price of gasoline and number of miles driven per week
The number of legs on a centipede is an example of a(an) _______ scale.
a. nominal c. ratio
b. ordinal d. continuous
If the value of r does not differ significantly from zero, as one variable increases, the other variable _____.
a. increases c. first increases, then decreases
b. decreases d. does not change systematically
Using an ordinal scale to assess leadership, which of the following statements is appropriate?
a. A has twice as much leadership ability as B
b. X has no leadership ability
c. Y has the most leadership ability
d. all of these
If r has a negative value, then as one variable increases, the other variable _____.
a. increases c. first increases, then decreases
b. decreases d. shows no systematic change
Number of bar presses is an example of a(n) _______ variable.
a. discrete c. nominal
b. continuous d. ordinal
 Quick Reply