Definition for H-R diagram
From Biology Forums Dictionary
Revision as of 11:46, 7 August 2013 by Nite n day (Talk | contribs) (Created page with "The Hertzsprung–Russell diagram is a scatter graph of stars showing the relationship between the stars' absolute magnitudes or luminosities versus their spectral types or class...")
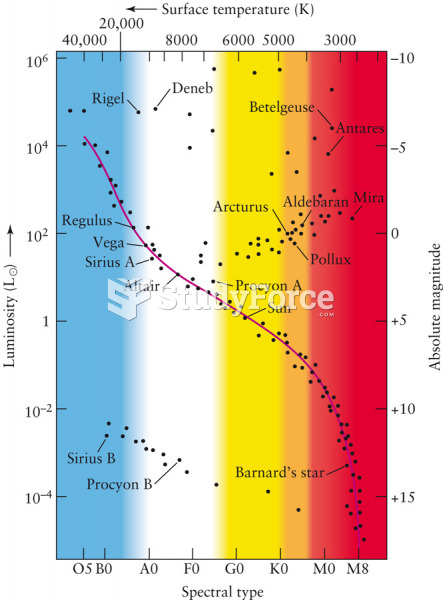
The Hertzsprung–Russell diagram is a scatter graph of stars showing the relationship between the stars' absolute magnitudes or luminosities versus their spectral types or classifications and effective temperatures. Hertzsprung–Russell diagrams are not pictures or maps of the locations of the stars. Rather, they plot each star on a graph measuring the star's absolute magnitude or brightness against its temperature and color.
Hertzsprung–Russell diagrams are also referred to by the abbreviation H–R diagram or HRD. The diagram was created circa 1910 by Ejnar Hertzsprung and Henry Norris Russell and represents a major step towards an understanding of stellar evolution or "the lives of stars".