|
|
A free membership is required to access uploaded content. Login or Register.
Assignment 4 GLO
|
|
Uploaded: 7 years ago
Category: Biology
Type: Assignment
Rating:
(4)
|
Filename: Assignment_4_GLO.docx
(152.68 kB)
Page Count: 1
Credit Cost: 1
Views: 2772
Downloads: 16
Last Download: 2 years ago
|
Transcript
Assignment #4
BSC1005 3.1.1 GLO– Fall 2016 (2017-1)
Name: Francis Key
Directions: Type your answers directly on this sheet in the space provided after each question. Please either highlight your answer or type them in RED font. Upload your Assignment as a .doc, .docx or .rtf file when you are finished.
This assignment is worth 20 points total.
Please watch a recorded video that I made on how to use the website provided (http://scienceprimer.com/punnett-square-calculator ) to answer the following assignment. It can be found under the Panopto Recordings Tab. (It will be labeled as Assignment #3 GLO instead of #4 because I use this for another class)
BSC1005 3.1.1 GLO– Fall 2016 (2017-1)
Genetics Assignment
Using a Punnett Square
A Punnett square is a chart that allows you to easily determine the expected percent of different genotypes in the offspring of two parents. An example of a Punnett square for pea plants is shown below. In this example, both parents are heterozygous for flower color (Bb). The gametes produced by the male parent are at the top of the chart, and the gametes produced by the female parent are along the side. The different possible combinations of alleles in their offspring are determined by filling in the cells of the Punnett square with the correct letters (alleles).
This Punnett square shows a cross between two heterozygotes. Do you know where each letter (allele) in all four cells comes from? (Image courtesy of CK Foundation and under the Creative Commons license CC-BY-NC-SA 3.0.)
Predicting Offspring Genotypes
In the cross shown in the figure above, you can see that one out of four offspring (25 percent) has the genotype BB, one out of four (25 percent) has the genotype bb, and two out of four (50 percent) have the genotype Bb. These percent of genotypes are what you would expect in any cross between two heterozygous parents. Of course, when just four offspring are produced, the actual percent of genotypes may vary by chance from the expected percent. However, if you considered hundreds of such crosses and thousands of offspring, you would get very close to the expected results — just like tossing a coin.
Predicting Offspring Phenotypes in a Monohybrid Cross
You can predict the percent of phenotypes in the offspring of this cross from their genotypes. B is dominant to b, so offspring with either the BB or Bb genotype will have the purple-flower phenotype. Only offspring with the bb genotype will have the white-flower phenotype. Therefore, in this cross, you would expect three out of four (75 percent) of the offspring to have purple flowers and one out of four (25 percent) to have white flowers. These are the same percents that Mendel got in his first experiment. In this instance purple-flower color is dominant over white flower color.
Please answer the following questions using the Punnett Square Calculator (link below) if you are able to answer the questions without the provided calculator, please use it to check your work. http://scienceprimer.com/punnett-square-calculator
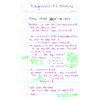
1. What are the percents of genotypes you would expect in any cross between two heterozygous parents?
a. BB _____25_____%
b. Bb ___50_______%
c. bb ___25_______%
2. What are the percents of phenotypes you would expect in any cross between two heterozygous parents?
a. Purple _____75______%
b. White ____25_______%
3. Predict the percents of genotypes you would expect in any cross between a homozygous dominant parent and a homozygous recessive parent.
a. BB _____25_____%
b. Bb ___50_______%
c. bb ____25______%
4. Predict the percents of phenotypes you would expect in any cross between a homozygous dominant parent and a homozygous recessive parent.
a. Purple ____75_______%
b. White _____25______%
5. Predict the percents of genotypes and phenotypes you would expect in any cross between a heterozygous parent and a homozygous recessive parent.
a. BB ___25_______%
b. Bb _____50_____%
c. bb ____25______%
Predicting Offspring Phenotypes in a Dihybrid Cross
Now that you have mastered predicting the percent of phenotypes in a monohybrid cross, let’s look at tracking two traits simultaneously. We will continue to use the purple/white phenotype where B is dominant to b, so offspring with either the BB or Bb genotype will display the purple-flower phenotype and bb genotype will yield only white flowers. We will add a second plant phenotype, tall and dwarf plant size. The tall allele is dominant to the dwarf allele and is located on a separate chromosome. AA and Aa genotypes will produce tall plants. Only aa plants will be dwarf plants.
Again, please answer the following questions using the Punnett Square Calculator (link below) if you are able to answer the questions without the provided calculator, please use it to check your work. http://scienceprimer.com/punnett-square-calculator Note: when entering information for the following crosses into the calculator, you must check the box to specify that B is dominant to b and A is dominant to a.
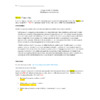
6. How many different phenotypes could be produced from a cross between complete heterozygotes (AaBb x AaBb).
_____9____ phenotypes
7. How many different genotypes could be produced from a cross between complete heterozygotes (AaBb x AaBb).
____9______ genotypes
8. Use the Punnett Square calculator [http://scienceprimer.com/punnett-square-calculator] to observe the phenotypic and genotypic ratios for crosses that have 3, 4, and 5 different traits (do this by sliding the ‘Number of traits in cross’ bar to the right). What conclusions can you make regarding the amount of traits tracked and the phenotypic and genotypic possibilities?
The more traits you have the higher the number of phenotypic and genotypic possibilities
9. As of 2015, the world population is 7.244 billion and recent reports suggest humans have between 20,000 and 25,000 genes and at least 8% of these genes have multiple alleles. Based on the data you have collected using [http://scienceprimer.com/punnett-square-calculator], would you expect there to be individuals that have identical genotypes (outside of identical twins)? How about identical phenotypes, could there be someone in the world that is phenotypically identical to you? Please explain your answer.
There is a very small percentage of people who will have the same genotype or phenotype as myself. The more traits you add the percentage goes down of people having the same genes as you. The less number of genes the better chance of someone having the same gene as myself/ Example if the lottery only used numbers 10 numbers instead of 64 your chances of getting all the numbers right increases because there are less numbers to choose from and to be drawn.
|
|
Comments (0)
|
Post your homework questions and get free online help from our incredible volunteers
|