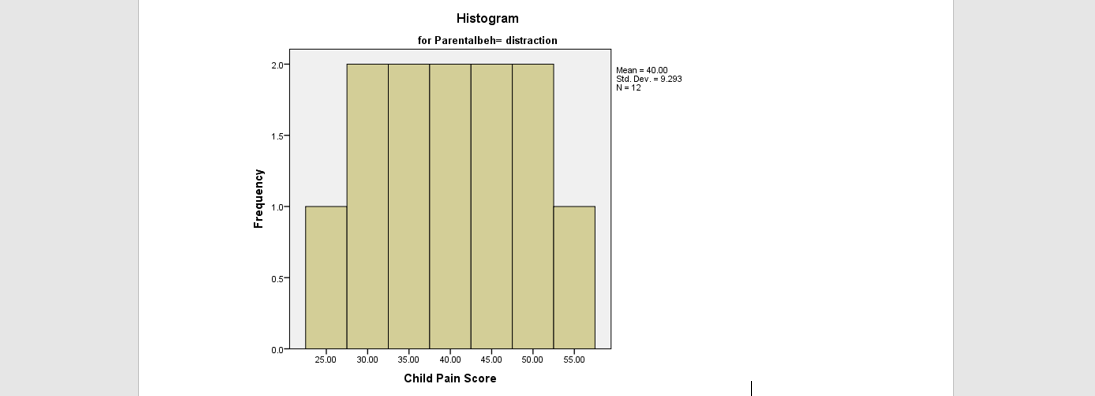
Based on the two histograms below, what does it imply about the variable's distribution? To check for the normality, what other methods can you use besides histograms?


Background Information:
In the research beneath, researchers sought to discover what parenting behaviors aid children in feeling less pain throughout routine, straightforward medical procedures.
They did this by watching a variety of venepuncture (shot) operations for kids between the ages of 6 and 7 receiving a normal vaccination as part of their typical medical treatment take place in a local general practitioner place. In order to manage for the potential impact of sex and gender difference in parent – child responding between mums and dads, as well as variation in parental responding in only one or single - parent households models, all parents who accompanied the children were moms in heterosexual mother child dyad. Before the treatment, all parents were instructed on and urged to use one of two behavioral support strategies for their kids: either using words to comfort them emotionally or using distraction techniques.
24 mom and child dyads in all were recruited by the researchers, and they divided them equally among the two support settings. After the process, the kids were asked to use a graphical analog scale to indicate how excruciating they thought the blood collection process had been. They were shown a 100micrometers line with the words "highest pain possible" on the far right and "no physical discomfort" at all on the far left of the line.
The children were instructed to mark where they were in pain on the line, and the distance measured in millimeters from the extreme left to the mark served as the children's perceived pain level, which resulted in scores ranging from 0 to 100. Section 1 of the study was this.
Parents were also required to take a State Catastrophizing test, which measured how likely they were to use catastrophizing as a coping mechanism in stressful situations.
Section 2 of the investigation was this.


