|
|
A free membership is required to access uploaded content. Login or Register.
Charges and Electric Fields PHET VIRTUAL LAB
|
|
Uploaded: 3 years ago
Category: Physics
Type: Lecture Notes
Rating:
N/A
|
Filename: Charges and Electric Fields PHET VIRTUAL LAB.docx
(7.55 MB)
Page Count: 9
Credit Cost: 9
Views: 132
Last Download: N/A
|
Transcript
Physic for Engineers 2
Virtual Laboratory No. 2
Charges and Fields
Objective:
To prove the Coulomb’s Law, Electric field, electric potential energy, and electric potential in a simulation.
To give students visualization of the effect of charged bodies to another.
Compare the results of the theory vs the simulation.
Equipment:
Virtual lab at https://phet.colorado.edu/sims/html/gas-properties/latest/gas-properties_en.html
Set Up:
361315457200Space
00Space
37804292530694Reset Button
00Reset Button
24975401418400Electric Potential Measuring Device
00Electric Potential Measuring Device
36166561786890Measuring Device
00Measuring Device
27704962107612Test Point
00Test Point
15626692107612Negative charge
00Negative charge
4299042141732Positive charge
00Positive charge
Positive Charge
A +1 nC charge that can be drag in the space.
Negative Charge
A -1 nC charge that can be drag in the space.
Test Point
Serve as a test point in space.
Measuring Device
Measures distance between charges and test points.
Electric Potential Measuring Device
Measures the electric potential exist in point in space.
Procedure:
Part I: Electric Fields Phenomena
Drag a positive charge at the center of the space. Notice the direction of the electric field. Describe.
Screenshot
Description
In the simulation, the arrow represents the electric field lines or the direction of the electric field of a positive charge, that means for a point charge, the direction of the electric field is always pointing away (outwards) from the positive point charge.
Reset the space by pressing the RESET button and drag the negative charge towards the center of the space. Describe the phenomenon.
Screenshot
Description
In the simulation, the arrow represents the electric field lines or the direction of the electric field of a negative charge, that means for a point charge, the direction of the electric field is pointing towards the negative point charge.
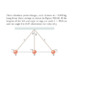
Reset the space by pressing the RESET button. Drag a +1nC and -1nC to space in whatever distance. Observe and describe the electric fields.
Screenshot
Description
I observed that there is an electric field that is shown emanating or pointing away from the positive charge and going into the negative charge and that is the direction that a positive charge would feel a force if they are placed together so it is going to be repelled by the positive charge and attracted to the negative charge. We can also notice that the brightness of the arrows (magnitude of electric fields) is getting weaker and lower when it is far from the point charges.
Repeat step 3 by dragging two +1 nC.
Screenshot
Description
The simulation showed a repulsion reaction between the two positive charges. The electric field were always pointing away from each of the positive charge. The electric field is no ending but as it gets farther from the positive charge, the electric field will get weaker than the electric field near the charge.
Repeat step 3 by dragging two –1 nC.
Screenshot
Description
The simulation showed a repulsion reaction between the two negative charges. The electric field were always pointing towards each negative charges. They do not cross path against each other.
Part II: Electric Field Measurement and Calculations
Reset the simulation. Drag a +1 nC charge on the space. Drag a measuring device. Notice that the measure device has two “+”, these are the two endpoints of the measurement. Make it center to the charge as much as possible to obtain minimal errors.
Drag SENSOR to the point shown in the table below. Used the measuring device obtain the indicated distance. Use the potential measuring device to obtain the electric potential at that point.
Distance, cm
Electric Field, V/m
Electric Potential, V
50
36.2 V/m
18.100 V
100
8.80 V/m
8.800 V
150
3.98 V/m
5.970 V
200
2.25 V/m
4.50 V
250
1.45 V/m
3.625 V
300
1.00 V/m
3.000 V
350
0.74 V/m
2.590 V
Graph the values between distance and electric field strength.
Questions:
What can you say about the relationship between the distance and electric field strength?
The strength of an electric field as created by the source charge is inversely related to square of the distance from the source. Electric field strength is position dependent, and its electric field magnitude decreases as the distance increases.
What happens to the electric field strength when the distance is doubled?
If the distance between the two charges is doubled, the attraction or repulsion and the electric field strength becomes weaker.
How are you going to weaken the electric field strength to one-half of its original strength?
We can weaken the electric field strength to one-half of its original strength by increasing a half more distance of its original distance.
What can you say about the relationship between the distance and electric potential?
Electric potential is equal to the magnitude of the electric field over distance. Electric potential decreases as it moves farther from the charge and we can say that electric potential is inversely proportional to the distance from the source.
What happens to the electric potential when the distance is doubled?
If the distance between the two charges is doubled, the electric potential decreases by one-half, therefore, it proves that the electric potential is inversely proportional to the distance of the charge.
How are you going to increase the electric potential by twice of its original value?
We can increase the electric potential twice of its original value when we move the point charge closer or decrease the distance by half.
Predict all the value of electric field strength and electric potential per distance indicated on Step 2. Compare your answer on step 2.
Get the % error of your observed values and predicted values based on theory of electric field calculations.
% Error=Observed value-Predicted valuepredicted valuex100%
Distance, cm
Electric Field Strength, V/m
Electric Potential
Observed
Predicted
% Error
Observed
Predicted
% Error
50
36.2 V/m
35.95 V/m
0.69%
18.100 V
18.040 V
0.33%
100
8.80 V/m
8.99 V/m
2.11%
8.800 V
8.838 V
0.43%
150
3.98 V/m
4.00 V/m
0.50%
5.970 V
5.959 V
0.18%
200
2.25 V/m
2.25 V/m
0%
4.50 0V
4.480 V
0.45%
250
1.45 V/m
1.44 V/m
0.69%
3.625 V
3.589 V
1.14%
300
1.00 V/m
1.00 V/m
0%
3.000 V
3.000 V
0%
350
0.74 V/m
0.73 V/m
1.37%
2.590 V
2.578 V
0.47%
Edit the data on the graph below to plot your values on step 5.
Show your solutions here. Maintain 2 decimal place for Electric Field Strength and 3 decimal place for Electric Potential.
0-63500
0-63500
|
|
Comments (0)
|
Post your homework questions and get free online help from our incredible volunteers
|