Transcript
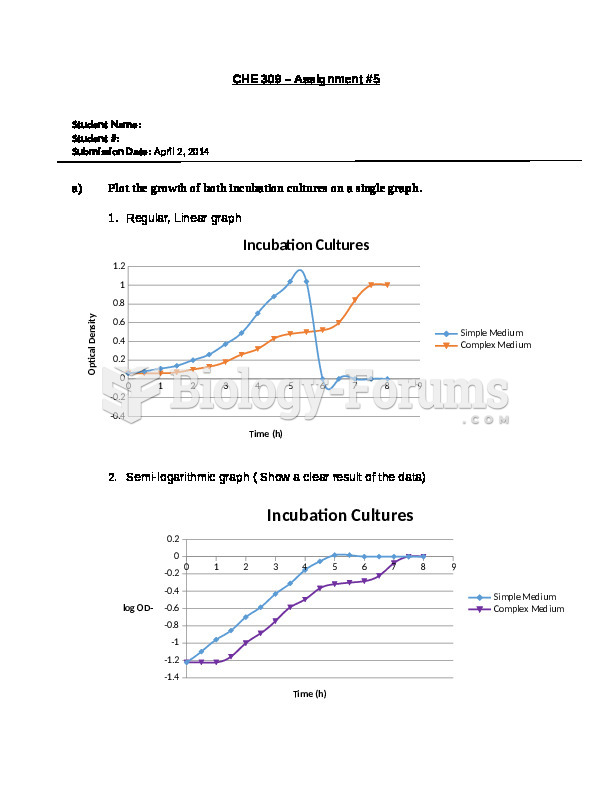
CHE 309 – Assignment #5 Student Name: Student #: Submission Date: April 2, 2014 -18097536195 Plot the growth of both incubation cultures on a single graph. Regular, Linear graph Semi-logarithmic graph ( Show a clear result of the data) b) Determine the boundaries of the exponential phases of growth, for each incubation cultures. Ans: Medium Type Time (h) OD, - (1) Simple Medium 0-4 0.06-0.7 Complex Medium (a) 1.0-3.5 0.06-0.26 Complex Medium (b) 6.5-7 0.6-0.84 c) Calculate the value of all maximum specific growth rates present on the graph. Ans: 2333625198120Maximum specific growth rate: µMax= lnX2-lnX1 t2-t1 The Maximum specific growth rate for simple medium: µMax = (ln 0.7-ln 0.06)/ (4.0-0.0) h = 0.6142 h-1 The Maximum specific growth rate for complex medium (a): µMax = (ln 0.26-ln 0.06)/ (3.5-1.0) h = 0.5865 h-1 The Maximum specific growth rate for complex medium (b): µMax = (ln 0.84-ln 0.6)/ (7.0-6.5) h = 0.6729 h-1 d) Assuming that each 0.175 OD value corresponds to 0.1 mg dry weight of cells per milliliter of incubation medium, re-calculate all values in c) with the new units. The Maximum specific growth rate for simple medium: µMax = (ln 0.7-ln 0.06)/ (4.0-0.0) h = 0.6142 h-1 *[(0.1mg/mL)/ (0.175)] = 0.351mg/mL.h The Maximum specific growth rate for complex medium (a): µMax = (ln 0.26-ln 0.06)/ (3.5-1.0) h = 0.5865 h-1 *[(0.1mg/mL)/ (0.175)] = 0.3351mg/mL.h The Maximum specific growth rate for complex medium (b): µMax = (ln 0.84-ln 0.6)/ (7.0-6.5) h = 0.6729 h-1 *[(0.1mg/mL)/ (0.175)] = 0.3845mg/mL.h e) Calculate the overall yield, YX/S, assuming substrate exhaustion in each case. Yx/s=-X/ S The Maximum specific growth rate for simple medium: 4000502305050 Yx/s= (1.04-0.06) *[(0.1mg cells/mL)/ (0.175)] 0.3mg glucose/mL = 1.8667 mg Cells/mg glucose The Maximum specific growth rate for complex medium (a): 304800228600Yx/s= (1.0-0.06) *[(0.1mg cells/mL)/ (0.175)] 0.15mg glucose/mL = 3.581 mg Cells/mg glucose The Maximum specific growth rate for complex medium (b): 304800228600Yx/s= (1.0-0.06) *[(0.1mg cells/mL)/ (0.175)] 0.15mg lactose/mL = 3.581 mg Cells/mg lactose f) Explain the shape of all growth curves. The growth curve for the simple medium the graph has no lag phase. However, the graph starts from the exponential phase followed by deceleration phase. For complex medium, the growth curve has lag phase due to the low concentration of the glucose and lactose nutrient. However, there is an exponential growth phase followed by the deceleration phase and then stationary phase that starts at the end of the decoration phase when the net growth rate is equal to zero for first medium of glucose. For the second medium lactose the growth graph has lag phase, exponential growth phase followed by the deceleration and then stationary phase.


")

")


")


")


