Transcript
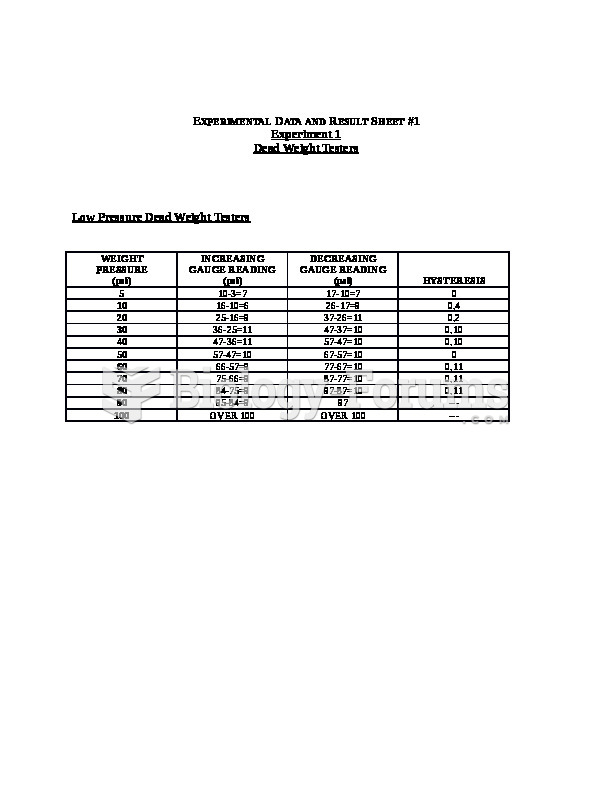
Experimental Data and Result Sheet #1 Experiment 1 Dead Weight Testers Low Pressure Dead Weight Testers Weight pressure (psi) Increasing Gauge Reading (psi) Decreasing Gauge Reading (psi) Hysteresis 5 10-3=7 17-10=7 0 10 16-10=6 26-17=9 0.4 20 25-16=9 37-26=11 0.2 30 36-25=11 47-37=10 0.10 40 47-36=11 57-47=10 0.10 50 57-47=10 67-57=10 0 60 66-57=9 77-67=10 0.11 70 75-66=9 87-77=10 0.11 80 84-75=9 97-87=10 0.11 90 95-84=9 97 --- 100 over 100 over 100 --- Experimental Data and Result Sheet #2 Experiment 1 Dead Weight Testers Low Pressure Dead Weight Testers weight pressue (psi) incrasing gauge reading (psi) decreacing gauge reading (psi) hysteresis 5 10-2.5=7.5 15-7.5=7.5 0 10 15-10=5 25-15=10 0.7 20 25-15=10 36-25=11 0.5 30 36-25=11 48-36=12 0.3 40 47-36=11 58-48=10 0.1 50 58-47=11 68-58=10 0.1 60 67-58=9 77-67=10 0.11 70 78-67=11 87-77=10 0.1 80 86-78=8 98-87=11 0.3 90 98-86=12 98 ---- 100 OVER HUNDERD 99 ---- Calculations: Sample calculation for hysteresis using data sheets #1 From 5 to 10 psi reading: Increasingly: 16 – 10 = 6 Decreasingly: 27-16=9 Average pressure reading = (9+6)/2 =7.5 Hysteresis= (9-6)/7.5= 0.4 Average hysteresis= (0+0.4+0.2+0.10+0.10+0.11+0+0.11+0.11+)/9 = 0.19 Sample calculation for hysteresis using data sheets #2 The hysteresis for a weight pressure reading of 5 to 10 psi was calculated as shown below: Average decreasing gauge reading= 25-15= = 10 Average increasing gauge reading= 15-10 = 5 Average pressure gauge reading= (10+5)/2= 7.5 Hysteresis = (10-5)/7.5 =0.7 Average Hysteresis= (0+ 0.7+0.5+0.3+0.1+0.1+0.11+0.1+0.3)/9 = 0.24 Discussion and Conclusions: The Dead weight tester is a technique used to measure and calibrate the pressure by placing masses on platform that effect the volume of the oil in the tester which will give a gauge pressure reading. However, the objective of this lab was to determine experimentally the effect of the pressure of the weight on the hysteresis. When, the weights were placed increasingly on the platform, starting with 5 psi to 100 psi. The observation of this increment was that the reading were almost the same, in other words it is a constant increment. Same observation was made when the masses were decreasingly removed. Through the result that had obtained from data sheet #1 and #2, the hysteresis for the second trial was higher than the first one because the elastic deformation for the second trial on a bourdon tube gauge was higher than the first one. For example, the graph of the second trial showed a higher hysteresis for the difference of the decreasing and the increasing of the weight which was 0.24. Whereas, the graph of the first trail showed a little bit difference of the decreasing and increasing of the weight against hysteresis of 0.19. In conclusions, through the calculations, results and graphs, it was observed that the effect of the hysteresis on the bourdon tube gauge pressure is decreased as the weight pressure is increased. Thus, the relationship between the hysteresis and the differences of the weight pressure is inversely propositional. A graph for the hysteresis VS the mass shows the linear relation for data sheets #`1: A graph of the Pressure of the Weight (psi) Vs. the Hysteresis for Data Sheets #2 References: Process Measurements lab manual ‘Dead Weight Tester’ page 4-7