Transcript
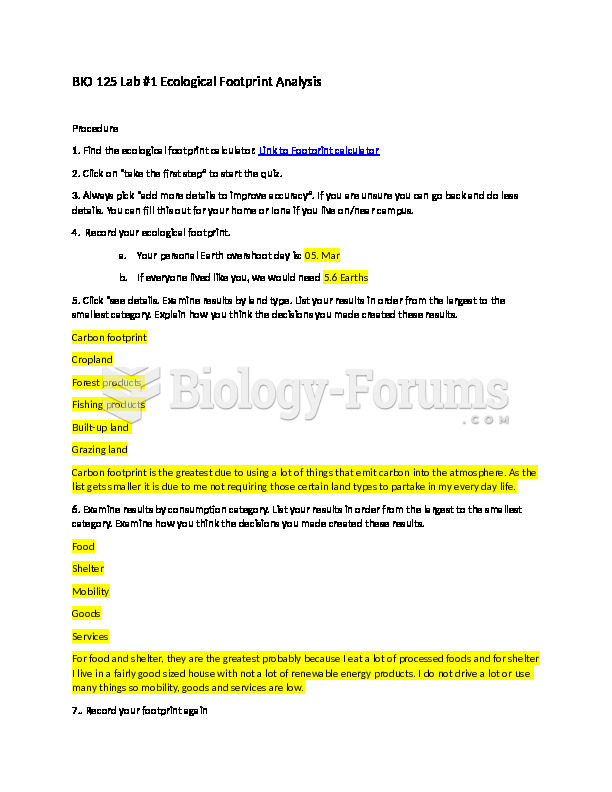
BIO 125 Lab #1 Ecological Footprint Analysis Procedure 1. Find the ecological footprint calculator. Link to Footprint calculator 2. Click on “take the first step” to start the quiz. 3. Always pick “add more details to improve accuracy”. If you are unsure you can go back and do less details. You can fill this out for your home or Iona if you live on/near campus. 4. Record your ecological footprint. Your personal Earth overshoot day is: 05. Mar If everyone lived like you, we would need 5.6 Earths 5. Click “see details. Examine results by land type. List your results in order from the largest to the smallest category. Explain how you think the decisions you made created these results. Carbon footprint Cropland Forest products Fishing products Built-up land Grazing land Carbon footprint is the greatest due to using a lot of things that emit carbon into the atmosphere. As the list gets smaller it is due to me not requiring those certain land types to partake in my every day life. 6. Examine results by consumption category. List your results in order from the largest to the smallest category. Examine how you think the decisions you made created these results. Food Shelter Mobility Goods Services For food and shelter, they are the greatest probably because I eat a lot of processed foods and for shelter I live in a fairly good sized house with not a lot of renewable energy products. I do not drive a lot or use many things so mobility, goods and services are low. 7.. Record your footprint again Your Ecological footprint (gha) 9.6 Your Carbon Footprint (CO2 emission, tonnes CO2) 15.5 Your Carbon Footprint, % total 55 8. How do you feel? Pretty guilty considering it looks like I am making choices that are bad for the environment. 9. Put your data on the class excel file. Record the average footprint of the class here. 7.23 10. Click on “explore your data”. Click on the US. Note that it states the biocapacity per person (gha) and the average ecological footprint per person (gha). The biocapacity of the US is our ecosystem’s capacity to produce biological materials used by people and to absorb waste materials generated by humans, under current management schemes and extraction technologies. The relationship of biocapacity to footprint determines whether a country/region is in an ecological deficit or ecological surplus. a) is your footprint more or less than the average person in the US? What about the class overall? Why? My footprint would be more than the average of 2017. The class average is less than the average person of the US. This is due to everyone’s habits and a use of things that are better for the environment like what they are consuming, how they are living, or traveling. b) Is the US in an ecological deficit or surplus? Why? Deficit because of the way people are living. They are eating more processed foods, traveling more, using less renewable resources. c) How the US footprint and capacity changed over time? Why do you think? The US footprint deficit has increased over time due to increases in the use of new technology and the use of more resources. 11. Click on “ecological footprint per person” on the bottom of the map. Which countries have highest footprints? Why? How do the results differ when you instead select “total ecological footprint”? United States, Canada, Australia. This is due the individual’s way of living and them using more resources. Also, there is advanced technology which allows people to use a greater of a carbon imprint. When the total ecological footprint is selected, the United States, China and India become the darkest due to their population. 12. Click on “biocapacity per person” on the bottom of the map. Which countries have highest biocapacity? Why? How do the results differ when you instead select “total biocapacity”? Bolivia, Guyana, Australia, Canada, Mongolia. This is because they may have not used as many resources and also do not have as much of a carbon footprint. The results differ when I select total biocapacity because it seems that countries with more land have bigger total capacities. 13. Think about the fairness of world land use. In 2019 U.S. had an ecological footprint of 8.04 gha/person while Africa’s was 1.23 gha/person. Do you think there should be laws governing how large a country’s or individual’s ecological footprint? Explain. Possibly, but it should be more like getting other countries up to speed with technology and the uses of resources. Maybe there should be a law requiring limited use of resources that are detrimental to the environment. Are there better ways to convince people to reduce their ecological footprint? Explain. You could possibly offer an incentive, but a lot of people are lazy so the incentives must be big. 14. Click on “explore solutions” and read through the offered solutions. Which ones do you think would be the easiest for you to implement? Which ones would be most difficult? Planet and energy would be the easiest to implement because it does not require as much work. People could be hired to protect ecosystems by planting trees and government can close off some designated areas. Renewable energy is also becoming popular and cheaper in the long run, so people would more likely use it. Food and population would be the hardest because there will not ber many people who want to stop eating certain foods that they enjoy. Population, also, because people want the ability to choose what they want and the number of kids they want, so it would essentially be limiting to their freedom. Maybe placing a limit on an absurd amount of kids would work. 15. Will you commit to doing one activity to reduce your footprint? Record it here. Yes. Food, I am a swimmer and need to eat healthy in order to swim faster and make my body leaner. 16. According to the Footprint Network, “Earth Overshoot Day marks an unfortunate milestone: the day in which we exhaust our ecological budget for the year. Once we pass this day [each year], humanity will have demanded all the ecological services – from filtering CO2 to producing the raw materials for food – that nature can provide this year. From that point until the end of the year, we meet our ecological demand by liquidating resource stocks and accumulating carbon dioxide in the atmosphere.” The Earth first experienced overshoot on December 19, 1987. Earth Overshoot Day was delayed by 3 weeks in 2020. Why? We did not have to use as many resources or emit as much carbon due to COVID-19 and people staying in their homes. Here is a graph showing earth overshoot day for the world since 1969. Explain what it shows you. What has happened to the rate of change in recent yer The rate of change has gradually increased over the years, but in 2020 it did not due to COVID. Homework (or in class if time allows). Due next lab, Tu 9/7 or Wed 9/9. Visit https://data.footprintnetwork.org/#/exploreData Click on “explore the data”. Do some exploration. Make two graphs. Write one paragraph for each graph where you a) describe the relationships depicted in your graph, and b) analyze the graph, or explain why you think it looks the way it does. Cite any outside research. Once you make the graph you can click on the three lines to export the file. Do so and include in this document. 1. Graph 1. Compare two countries or regions for “reserve/deficiet trends”. Write one paragraph for each graph where you a) describe the relationships depicted in your graph, and b) analyze the graph, or explain why you think it looks the way it does. Cite any outside research. In both countries, it is seen that as the years go on, global hectares steadily increases for the majoirty of time. Both countries are in an ecological deficit that outweighs the ecological reserve which makes sense when you are usuing more resources than you have available to you. The united states has a much larger global hectare each year because of the amount of land we have and our population. The ecologcial deficit rate is always the same and the gap doesn’t get much bigger for both countries which could be due to bio capacity changing and the use of different materials and a chance in habits. The graphs look like this because we continue to use more than our biocapacity. Graph 2. Choose either “analyze by land type” or “socioeconomic relationships”. Write one paragraph for each graph where you a) describe the relationships depicted in your graph, and b) analyze the graph, or explain why you think it looks the way it does. Cite any outside research. Between America and Uzbekistan, a trend is scene that as population increases for both countires, the global hecatres do. The Unitred States’s ecological footprint never falls below its biocapacity and the same trend is seen with Uzbekistan’s footprint staying above the biocapacity. Each countires ecological footprint are also around double the capacity which creates a deficit becaue more is being used that is avalable. It seems that as the bio capacity increases, so does the ecological footprint which is due to the use of more fossil fules and natural resources. There are no long term decreases in both countries due to population increases which results in a higher ecological footprint. The graph looks the way it dfoes duer to our bad habbits and an increase of carbon resources and the use of more raw materials.


")

")


")


")


