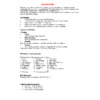
Transcript
CHAPTER FOUR EXPERIMENTAL RESULTS AND DISCUSSION
4.1 Overview
This chapter presents the training and testing results of the neural network dental identification system. The experiments were carried out for the training and testing stage. The networks were comparing to other similar work. The testing of dental identification system was also carried out with an extra experiment. The results for each experiment are discussed in the next section.
4.2 General Experimental Setup
The comparison was based on three criteria:
Experiment time cost
Number of epochs
Identification performance
Two different experiments were carried out on each quarter. The difference between the experiments was the number of training and testing images as well as the values ??of the training parameters during training process.
Training and testing the neural networks was implemented using the following system configuration: 2.2 GHz PC with 1 GB of RAM using Windows 7 32-bit operating system, and Matlab software tool.
The threshold value used to differentiate between the identified and not identified pattern was 70%.
4.3 First Experiment
As shown in the tables below in some cases. The training and testing accuracies were high which depends on the method of training the neural networks and the algorithm used in training. The number of images that were used in the first experiment is: two images for training and one image for testing for each quarter.
4.3.1 First Quarter
In the training and testing process, different set of dental radiography images used, as shown in figure 4.1, the training and testing process, which yielded the first quarter was successful and the parameters that have been used in the training process, the accuracy, identification rate and the performance of artificial neural network as shown below.
Figure 4.1 Samples of 1st Quarter Training and Testing Images for Experiment 1.
Table 4.1 shows the training and testing time and the final training parameters during experiment 1 of the first quarter.
Table 4.1 Training Parameters and Time Cost of 1st Quarter for 1st Experiment.
1
Number of Input Neurons
1250
2
Number of Hidden Neurons
88
3
Number of Output Neurons
50
4
Down Sampling Parameter
4
5
Averaging Parameter
16
6
Learning Rate
0.003
7
Momentum Factor
0.6
8
Error
0.0007
9
Number of Iterations
1037
10
Maximum Iterations
20000
11
Training Time1
408
12
Testing Time1
0.0448
1: Time was measured in seconds by using Matlab timer
Figure 4.2 shows the mean square error (MSE) and number of iteration, which represent the network performance of DIS during experiment 1 of first quarter.
Figure 4.2 1st Quarter Training Performance Curve for Experiment 1.
The identification rate and accuracy of 100 training images and 50 testing images was calculated. The training and testing identification rate and accuracy for first quarter in experiment 1 were calculated as shown in table 4.2.
Table 4.2 1st Quarter Training and Testing Identification Rate and Accuracy for Experiment 1.
Process
Identification Rate
Identification Accuracy
Training
(98/100) 98%
90.9488 %
Testing
(49/50) 98%
83.3916 %
4.3.2 Second Quarter
The following experiment, which has the second quarter which is based on the same principle of the first experiment with the second set of training and testing images, with different training parameters, as shown in figure 4.3.
Figure 4.3 Samples of 2nd Quarter Training and Testing Images for Experiment 1.
Table 4.3 shows the training parameters, training and testing time of the second images set that represents the second quarter of the mouth for experiment 1.
Table 4.3 2nd Quarter Training Parameters and Time Cost for Experiment 1.
1
Number of Input Neurons
1250
2
Number of Hidden Neurons
88
3
Number of Output Neurons
50
4
Down Sampling Parameter
4
5
Averaing Parameter
16
6
Learning Rate
0.005
7
Momentum Factor
0.3
8
Error
0.0007
9
Number of Iterations
3148
10
Maximum Iterations
20000
11
Training Time1
182
12
Testing Time1
0.4944
1: Time was measured in seconds by using Matlab timer
Figure 4.4 shows the mean square error (MSE) and number of iteration, which represent the network performance of DIS of second quarter for experiment 1.
Figure 4.4 2nd Quarter Training Performance Curve for Experiment 1.
Table 4.4 shows the neural network training and testing identification rate and accuracy that calculated from the first experiment second quarter training and testing images.
Table 4.4 2nd Quarter Training and Testing Identification Rate and Accuracy for Experiment 1.
Process
Identification Rate
Identification Accuracy
Training
(96/100) 96%
92.568 %
Testing
(48/50) 96%
91.9452 %
4.3.3 Third Quarter
Images that are used in this experiment were the third quarter of the training and testing images, as shown in the figure 4.5.
Figure 4.5 Samples of 3rd Quarter Training and Testing Images for Experiment 1.
The training parameters that used to train the neural network system were listed in table 4.5 of the third quarter for first experiment.
Table 4.5 3rd Quarter Training Parameters and Time Cost for Experiment 1.
1
Number of Input Neurons
1250
2
Number of Hidden Neurons
88
3
Number of Output Neurons
50
4
Down Sampling Parameter
4
5
Averaging Parameter
16
6
Learning Rate
0.004
7
Momentum Factor
0.07
8
Error
0.0007
9
Number of Iterations
7790
10
Maximum Iterations
20000
11
Training Time1
451
12
Testing Time1
0.5668
1: Time was measured in seconds by using Matlab timer
Figure 4.6 shows the mean square error (MSE) and number of iteration of the dental identification system during third quarter for first experiment.
Figure 4.6 3rd Quarter Training Performance Curve for Experiment 1.
Training and testing identification rate and accuracy of the system with the third quarter first experiment is shown in Table 4.6.
Table 4.6 3rd Quarter Training and Testing Identification Rate and Accuracy for Experiment 1.
Process
Identification Rate
Identification Accuracy
Training
(96/100) 96%
94.8515 %
Testing
(42/50) 84%
88.7176 %
4.3.4 Fourth Quarter
In figure 4.7 some examples of training and testing fourth quarter database set images, which are used for training and testing the neural network system.
Figure 4.7 Sample of 4th Quarter Training and Testing Images for Experiment 1.
The training and testing time and parameters values that used in the training the system for fourth quarter, first experiment has been listed in the Table 4.7.
Table 4.7 4th Quarter Training Parameters and Time Cost for Experiment 1.
1
Number of Input Neurons
1250
2
Number of Hidden Neurons
88
3
Number of Output Neurons
50
4
Down Sampling Parameter
4
5
Averaging Parameter
16
6
Learning Rate
0.006
7
Momentum Factor
0.7
8
Error
0.0007
9
Number of Iterations
6126
10
Maximum Iterations
20000
11
Training Time1
331
12
Testing Time1
0.0509
1: Time was measured in seconds by using Matlab timer
Figure 4.8 shows the training performance of neural network system for fourth quarter, first experiment.
Figure 4.8 4th Quarter Training Performance Curve for Experiment 1.
Table 4.8 shows the training and testing identification rate and accuracy for fourth quarter first experiment.
Table 4.8 4th Quarter Training and Testing Identification Rate and Accuracy for Experiment 1.
Process
Identification Rate
Identification Accuracy
Training
(96/100) 96%
95.225 %
Testing
(32/50) 64%
71.8678 %
4.4 Second Experiment
In the second experiment, which used one image for training and two images for testing. With the same procedures that used in previous experiments, the values ??of the training parameters that used in training process and the results of the training and testing process, the identification rate and network accuracy shown in the tables below.
4.4.1 First Quarter
Figure 4.9 shown examples of training and testing images of first quarter second experiment.
Figure 4.9 Samples of 1st Quarter Training and Testing Images for Experiment 2
Table 4.9 shows the training parameters that used in training process of the system and shows the training and testing time for the second experiment of the first quarter.
Table 4.9 1st Quarter Training Parameters and Time Cost for Experiment 2.
1
Number of Input Neurons
3200
2
Number of Hidden Neurons
120
3
Number of Output Neurons
50
4
Down Sampling Parameter
5
5
Averaging Parameter
4
6
Learning Rate
0.003
7
Momentum Factor
0.3
8
Error
0.0007
9
Number of Iterations
2080
10
Maximum Iterations
20000
11
Training Time1
307
12
Testing Time1
0.0247
1: Time was measured in seconds by using Matlab timer
Figure 4.10 shows the mean square error (MSE) and number of iteration, which represent the network performance of the dental identification system of the first quarter, second experiment.
Figure 4.10 1st Quarter Training Performance Curve for Experiment 2.
Table 4.10 shows the neural network training and testing identification rate and accuracy that calculated from the first quarter training and testing images for second experiment.
Table 4.10 1st Quarter Training and Testing Identification Rate and Accuracy for Experiment 2.
Process
Identification Rate
Identification Accuracy
Training
(48/50) 96%
92.9124 %
Testing
(96/100) 96%
92.8962 %
4.4.2 Second Quarter
Figure 4.11 shown examples of training and testing images of second quarter second experiment.
Figure 4.11 Samples of 2nd Quarter Training and Testing Images for Experiment 2.
Table 4.11 shows the training parameters that used in training process of the system and shows the training and testing time for second quarter, second experiment.
Table 4.11 2nd Quarter Training Parameters and Time Cost for Experiment 2.
1
Number of Input Neurons
3200
2
Number of Hidden Neurons
131
3
Number of Output Neurons
50
4
Down Sampling Parameter
5
5
Averaging Parameter
4
6
Learning Rate
0.00053
7
Momentum Factor
0.021
8
Error
0.0007
9
Number of Iterations
2431
10
Maximum Iterations
20000
11
Training Time1
302
12
Testing Time1
0.0984
1: Time was measured in seconds by using Matlab timer
Figure 4.12 shows the mean square error (MSE) and number of iteration, which represent the network performance of the dental identification system for second quarter, second experiment.
Figure 4.12 2nd Quarter Training Performance Curve for Experiment 2.
Table 4.12 shows the neural network training and testing identification rate and accuracy that calculated from the second quarter training and testing images, second experiment.
Table 4.12 2nd Quarter Training and Testing Identification Rate and Accuracy for Experiment 2.
Process
Identification Rate
Identification Accuracy
Training
(48/50) 96%
92.062 %
Testing
(96/100) 96%
89.9465 %
4.4.3 Third Quarter
Figure 4.13 shown examples of training and testing images of third quarter second experiment.
Figure 4.13 Sample of 3rd Quarter Training and Testing Images for Experiment 2.
Table 4.13 shows the training parameters that used in training process of the system and shows the training and testing time for third quarter, second experiment.
Table 4.13 3rd Quarter Training Parameters and Time Cost for Experiment 2.
1
Number of Input Neurons
3200
2
Number of Hidden Neurons
184
3
Number of Output Neurons
50
4
Down Sampling Parameter
5
5
Averaging Parameter
4
6
Learning Rate
0.08
7
Momentum Factor
0.6
8
Error
0.0007
9
Number of Iterations
2762
10
Maximum Iterations
20000
11
Training Time1
355
12
Testing Time1
0.0545
1: Time was measured in seconds by using Matlab timer
Figure 4.14 shows the mean square error (MSE) and number of iteration, which represent the network performance of the dental identification system for third quarter, second experiment.
Figure 4.14 3rd Quarter Training Performance Curve for Experiment 2.
Table 4.14 shows the neural network training and testing identification rate and accuracy that calculated from the third quarter training and testing images for third quarter, second experiment.
Table 4.14 3rd Quarter Training and Testing Identification Rate and Accuracy for Experiment 2.
Process
Identification Rate
Identification Accuracy
Training
(48/50) 96%
92.3202 %
Testing
(92/100) 92%
89.8987 %
4.4.4 Fourth Quarter
Figure 4.15 shown examples of training and testing images of fourth quarter second experiment.
Figure 4.15 Sample of 4th Quarter Training and Testing Images for Experiment 2.
Table 4.15 shows the training parameters that used in training process of the system and shows the training and testing time for fourth quarter, second experiment.
Table 4.15 4th Quarter Training Parameters and Time Cost for Experiment 2.
1
Number of Input Neurons
3200
2
Number of Hidden Neurons
177
3
Number of Output Neurons
50
4
Down Sampling Parameter
5
5
Averaging Parameter
4
6
Learning Rate
0.001
7
Momentum Factor
0.2
8
Error
0.0007
9
Number of Iterations
3890
10
Maximum Iterations
20000
11
Training Time1
651
12
Testing Time1
1.4991
1: Time was measured in seconds by using Matlab timer
Figure 4.16 shows the mean square error (MSE) and number of iteration, which represent the network performance of the dental identification system for fourth quarter, second experiment.
Figure 4.16 4th Quarter Training Performance Curve for Experiment 2.
Table 4.16 shows the neural network training and testing identification rate and accuracy that calculated from the fourth quarter training and testing images for fourth quarter, second experiment.
Table 4.16 4th Quarter Training and Testing Identification Rate and Accuracy for Experiment 2.
Process
Identification Rate
Identification Accuracy
Training
(48/50) 96%
91.3854 %
Testing
(87/100) 87%
87.1651 %
4.5 Extra Testing Experiment
To demonstrate that the capability of DIS to identify people through their dental radiography images. This extra experiment was carried out using dental radiography images that were not in the initial database. The dental radiography images were captured using a 12 Megapixel digital camera. The total number of images in this experiment was 6 images, 4 new and 2 from database. The results of this experiment are shown in below tables.
Table 4.17 Testing Identification Rate and Accuracy for Extra Experiment.
Quarters
Recognition Rate
Recognition Accuracy
Testing Time1
First Quarter
(2/6) 33%
49.32 %
0.0119
Second Quarter
(2/6) 33%
36.69 %
0.0099
Third Quarter
(2/6) 33%
49.78 %
0.034
Fourth Quarter
(2/6) 33%
48.99 %
0.0122
1: Time was measured in seconds by using Matlab timer
Table 4.18 shows the overall neural network training and testing identification rate and accuracy that calculated from the first and second experiments.
Table 4.18 Overall Training and Testing Identification Rate and Accuracy.
No.
process
Matching
Quarter 1
Quarter 2
Quarter 3
Quarter 4
Overall
1st Experiment
Training
Accuracy
90.94%
92.56%
94.85%
95.22%
93.39%
CIR1
98%
96%
96%
96%
96.5%
Testing
Accuracy
83.39%
91.94%
88.717%
71.86%
83.97%
CIR1
98%
96%
92%
94%
95%
2nd Experiment
Training
Accuracy
92.91%
92.06%
92.32%
91.38%
92.16%
CIR1
96%
96%
96%
96%
96 %
Testing
Accuracy
92.89%
89.94%
89.89%
87.16%
89.97%
CIR1
96%
96%
92%
87%
92.75%
1: Correct Identification Rate
4.6 Discussion
Several experiments were carried out on the dental identification system. The organization of the experiments was based on the number of images which are used in training and testing process. In the first experiment, the number of training and testing images was (2-1) images. In the second experiment, the number of training and testing images was (1-2) images. The best results were obtained through the second experiment with highest identification rate and accuracy which have carried out by using one image for training and two images for testing. Table 4.19 shows the identification rate and accuracy of the first and second experiment.
Table 4.19 Total Correct Identification Rate and Accuracy for Each Experiment.
Experiment No.
Matching
Training
Testing
Overall
1st Experiment
Accuracy
93.39%
83.97%
88.68%
CIR
96.5%
95%
95.75%
2nd Experiment
Accuracy
92.16%
89.97%
91.06%
CIR
96 %
92.75%
94.37%
There is several computer aided PM identification system. The computer assisted post mortem identification CAPMI and WinID are the most famous among these systems. These systems do not provide all the processing operation as neural network does such as, feature extraction, coding, and image comparisons are still carried- out manually by the odontologist.
This system was developed by the bioengineering branch of the US army institute of dental research. CAPMI is a computer software program that compares between dental codes extracted form AM and PM dental records, the program generates a list of candidates based on the number of matching dental characteristics. This list guides forensic odontologists to reference records that have potential similarity with subject records; the odontologist then completes the identification procedure by visual comparison of radiographs [42].
WinID is a computer system that matches missing persons to unidentified persons using dental and human body measurements characteristics to rank possible matches. This what makes the dental identification system using artificial neural networks perform this process automatically that saves time and do the identification process easier and with high accuracy, without the need for an expert in dental forensic or specialist odontologist to make the final decision of the identification system from the candidates list.
It was also a comparison with systems similar to the our system of dental identification base on dental radiography images using artificial neural networks as in reference [42] and [43], where it is the database used for training and testing were unknown and the identification rate and system accuracy was not clarify in a suitable formatting.
As we see in the above results, that the identification system based on dental radiographic images and using artificial neural networks techniques has achieved great success in the identification rate with high accuracy, Appendix II shows the rest of the results that achieved during training and testing that performed on the system.
4.7 Summary
This chapter explained the experimental result and performance analysis that has been carried out through training and testing the dental identification system. The results demonstrated the successful implementation of the system. Then making a comparison with other similar work and demonstrate that the usage of artificial neural network obtains high identification rate and accuracy.