The overall equation for the reaction between sodium carbonate solution and dilute hydrochloric acid is:

You had the two solutions of the same concentration, you would have to use twice the volume of hydrochloric acid to reach the equivalence point - because of the 1 : 2 ratio in the equation.
Suppose you start with 25 cm3 of sodium carbonate solution, and that both solutions have the same concentration of 1 mol dm-3. That means that you would expect the steep drop in the titration curve to come after you had added 50 cm3 of acid.
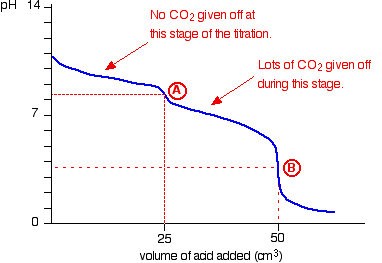
The actual graph looks like this:

The graph is more complicated than you might think - and curious things happen during the titration.
You expect carbonates to produce carbon dioxide when you add acids to them, but in the early stages of this titration, no carbon dioxide is given off at all.
Then - as soon as you get past the half-way point in the titration - lots of carbon dioxide is suddenly released.
The graph is showing two end points - one at a pH of 8.3 (little more than a point of inflexion), and a second at about pH 3.7. The reaction is obviously happening in two distinct parts.
In the first part, complete at A in the diagram, the sodium carbonate is reacting with the acid to produce sodium hydrogencarbonate:

You can see that the reaction doesn't produce any carbon dioxide.
In the second part, the sodium hydrogencarbonate produced goes on to react with more acid - giving off lots of CO2.

That reaction is finished at B on the graph.
It is possible to pick up both of these end points by careful choice of indicator. That is explained on the separate page on indicators.