Transcript
34Miller• Economics Today, Nineteenth Edition
Chapter 3Demand and Supply33
Answers to Problems
3-1. Suppose that in a recent market period, the following relationship existed between the price of tablet devices and the quantity supplied and quantity demanded.
Price Quantity Demanded Quantity Supplied
$330 100 million 40 million
$340 90 million 60 million
$350 80 million 80 million
$360 70 million 100 million
$370 60 million 120 million
Graph the supply and demand curves for tablet devices using the information in the table. What are the equilibrium price and quantity? If the industry price is $340, is there a shortage or surplus of tablet devices? How much is the shortage or surplus?
The equilibrium price is $350 per tablet device, and the equilibrium quantity is 80 million tablet devices. At a price of $340 per tablet device, the quantity of tablet devices demanded is 90 million, and the quantity of tablet devices supplied is 60 million. Hence, there is a shortage of 30 million tablet devices at a price of $340 per tablet.
3-2. Suppose that in a later market period, the quantities supplied in the table in Problem 3-1 are unchanged. The amount demanded, however, has increased by 30 million at each price. Construct the resulting demand curve in the illustration you made for Problem 3-1. Is this an increase or a decrease in demand? What are the new equilibrium quantity and the new market price? Give two examples of changes in ceteris paribus conditions that might cause such a change.
If quantity demanded increases by 30 million at each price, then the new equilibrium price is $360 per tablet device, and the new equilibrium quantity is 100 million tablet devices. This is an increase in demand, which could be brought about by a change in any of the ceteris paribus conditions relating to the demand curve. For example, an increase in the demand for tablet devices could arise from either a decrease in the price of a complement, such as tablet-device apps, or an increase in the price of a substitute, such as laptop computers or sophisticated smartphones.
3-3. Consider the market for cable-based Internet access service, which is a normal good. Explain whether the following events would cause an increase or a decrease in demand or an increase or a decrease in the quantity demanded.
a. Firms providing wireless (an alternative to cable) Internet access services reduce their prices.
b. Firms providing cable-based Internet access services reduce their prices.
c. There is a decrease in the incomes earned by consumers of cable-based Internet access services.
d. Consumers’ tastes shift away from using wireless Internet access in favor of cable-based Internet access services.
a. Wireless and cable Internet access services are substitutes, so a reduction in the price of wireless Internet access services causes a decrease in the demand for cable-based Internet access services.
b. A decrease in the price of cable-based Internet access services generates an increase in the quantity of these services demanded.
c. Cable-based Internet access services are a normal good, so a fall in the incomes of consumers reduces the demand for these services.
d. If consumers’ tastes shift away from wireless Internet access services in favor of cable-based Internet services, then the demand for the latter services increases.
3-4. In the market for portable power banks (a normal good), explain whether the following events would cause an increase or a decrease in demand or an increase or a decrease in the quantity demanded. Also explain what happens to the equilibrium quantity and the market clearing price.
a. There are increases in carry cases for portable power banks.
b. There is a decrease in the price of devices used to charge portable power banks.
c. There is an increase in the number of consumers of portable power banks.
d. A booming economy increases the income of the typical buyer of portable power banks.
e. Consumers of portable power banks anticipate that the price of this good will decline in the future.
a. Carry cases are complements in the consumption of portable power banks, so increases in their prices cause the demand for portable power banks to decline. The market clearing price of and equilibrium quantity of portable power banks both decline.
b. Devices used to charge portable power banks are a complement in the consumption of portable power banks, so a fall in the price of this item generates an increase in the demand for portable power banks. The market clearing price of and equilibrium quantity of portable power banks both increase.
c. An increase in number of consumers of portable power banks generates an increase in the demand for this item, which causes the both the market clearing price and equilibrium quantity of portable power banks to increase.
d. As long as portable power banks are a normal good, the rise in consumers’ incomes causes the demand for portable power banks to increase. This causes both the market clearing price and equilibrium quantity of portable power banks to increase.
e. Because consumers expect a lower price of portable power banks in the future, their current demand for portable power banks decreases. The result is a decrease in both the market clearing price and equilibrium quantity of portable power banks in the present.
3-5. Give an example of a complement and a substitute in consumption for each of the following items.
a. Bacon
b. Tennis racquets
c. Coffee
d. Automobiles
a. Complement: eggs; Substitute: sausage
b. Complement: tennis balls; Substitute: racquetball racquets
c. Complement: cream; Substitute: tea
d. Complement: gasoline; Substitute: city bus
3-6. For each of the following shifts in the demand curve and associated price change of a complement or substitute item, explain whether the price of the complement or substitute must have increased or a decreased.
a. A rise in the demand for a dashboard global-positioning-system device follows a change in the price of automobiles, which are complements.
b. A fall in the demand for e-book readers follows a change in the price of e-books, which are complements.
c. A rise in the demand for tablet devices follows a change in the price of ultrathin laptop computers, which are substitutes.
d. A fall in the demand for physical books follows a change in the price of e-books, which are substitutes.
a. decrease in price of automobiles
b. increase in price of e-books
c. increase in price of ultrathin laptop computers
d. decrease in the price of e-books
3-7. Identify which of the following would generate an increase in the market demand for tablet devices, which are a normal good.
a. A decrease in the incomes of consumers of tablet devices
b. An increase in the price of ultrathin computers, which are substitutes
c. An increase in the price of online apps, which are complements
d. An increase in the number of consumers in the market for tablet devices
b and d
3-8. Identify which of the following would generate a decrease in the market demand for e-book readers, which are a normal good.
a. An increase in the price of downloadable apps utilized to enhance the e-book reading experience, which are complements
b. An increase in the number of consumers in the market for e-book readers
c. A decrease in the price of tablet devices, which are substitutes
d. A reduction in the incomes of consumers of e-book readers
a, c, and d
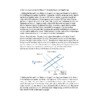
3-9. Consider the following diagram of a market for one-bedroom rental apartments in a college community.
a. At a rental rate of $1,000 per month, is there an excess quantity supplied, or is there an excess quantity demanded? What is the amount of the excess quantity supplied or demanded?
b. If the present rental rate of one-bedroom apartments is $1,000 per month, through what mechanism will the rental rate adjust to the equilibrium rental rate of $800?
c. At a rental rate of $600 per month, is there an excess quantity supplied, or is there an excess quantity demanded? What is the amount of the excess quantity supplied or demanded?
d. If the present rental rate of one-bedroom apartments is $600 per month, through what mechanism will the rental rate adjust to the equilibrium rental rate of $800?
a. At the $1,000 rental rate, the quantity of one-bedroom apartments supplied is 3,500 per month, but the quantity demanded is only 2,000 per month. Thus, there is an excess quantity of one-bedroom apartments supplied equal to 1,500 apartments per month.
b. To induce consumers to lease unrented one-bedroom apartments, some landlords will reduce their rental rates. As they do so, the quantity demanded will increase. In addition, some landlords will choose not to offer apartments for rent at lower rates, and the quantity supplied will decrease. At the equilibrium rental rate of $800 per month, there will be no excess quantity supplied.
c. At the $600 rental rate, the quantity of one-bedroom apartments demanded is 3,000 per month, but the quantity supplied is only 1,500 per month. Thus, there is an excess quantity of one-bedroom apartments demanded equal to 1,500 apartments per month.
d. To induce landlords to make more one-bedroom apartments available for rent, some consumers will offer to pay higher rental rates. As they do so, the quantity supplied will increase. In addition, some consumers will choose not to try to rent apartments at higher rates, and the quantity demanded will decrease. At the equilibrium rental rate of $800 per month, there will be no excess quantity demanded.
3-10. Consider the market for paperbound economics textbooks. Explain whether the following events would cause an increase or a decrease in supply or an increase or a decrease in the quantity supplied.
a. The market price of paper increases.
b. The market price of economics textbooks increases.
c. The number of publishers of economics textbooks increases.
d. Publishers expect that the market price of economics textbooks will increase next month.
a. The rise in the price of paper, a key input in textbook production, causes a decrease in the supply of textbooks.
b. An increase in the market price of economics textbooks causes an increase in the quantity of textbooks supplied.
c. A rise in the number of textbook publishers increases the supply of textbooks.
d. If publishers expect the market price of textbooks will rise next week, the current supply of textbooks will decline.
3-11. Consider the market for smartphones. Explain whether the following events would cause an increase or a decrease in supply or an increase or a decrease in the quantity supplied. Illustrate each, and show what would happen to the equilibrium quantity and the market price.
a. The price of touch screens used in smartphones declines.
b. The price of machinery used to produce smartphones increases.
c. The number of manufacturers of smartphones increases.
d. There is a decrease in the market demand for smartphones.
a. Because touchscreens are an input in the production of smartphones, a decrease in the price of touchscreens causes an increase in the supply of smartphones. The market supply curve shifts to the right, which causes the market price of smartphones to fall and the equilibrium quantity of smartphones to increase.
b. Machinery used to produce smartphones is an input in the production of these devices, so an increase in the price of machinery generates a decrease in the supply of smartphones. The market supply curve shifts to the left, which causes the market price of smartphones to rise and the equilibrium quantity of smartphones to decrease.
c. An increase in the number of manufacturers of smartphones causes an increase in the supply of smartphones. The market supply curve shifts rightward. The market price of smartphones declines, and the equilibrium quantity of smartphones increases.
d. The demand curve for smartphones shifts to the left along the supply curve, so there is a decrease in the quantity supplied. The market price falls, and the equilibrium quantity declines.
3-12. If the price of flash memory chips used in manufacturing smartphones decreases, what will happen in the market for smartphones? How will the equilibrium price and equilibrium quantity of smartphones change?
Because flash memory chips are an input in the production of smartphones, a decrease in the price of flash memory chips generates an increase in the supply of smartphones. The market price of smartphones will decrease, and the equilibrium quantity will increase.
3-13. Assume that the cost of aluminum used by soft-drink companies increases. Which of the following correctly describes the resulting effects in the market for soft drinks distributed in aluminum cans? (More than one statement may be correct.)
a. The demand for soft drinks decreases.
b. The quantity of soft drinks demanded decreases.
c. The supply of soft drinks decreases.
d. The quantity of soft drinks supplied decreases.
Aluminum is an input in the production of canned soft drinks, so an increase in the price of aluminum reduces the supply of canned soft drinks (option c). The resulting rise in the market price of canned soft drinks brings about an decrease in the quantity of canned soft drinks demanded (option b). In equilibrium, the quantity of soft drinks supplied decreases (option d) to an amount equal to the quantity demanded. The demand curve does not shift, however, so option b does not apply.
3-14. In Figure 3-2, what are the effects of a price decrease from $4 per portable power bank to
$2 per portable power bank on the quantities of portable power banks demanded by buyer
1 and by buyer 2 individually and combined?
For Buyer 1, the price decrease from $4 per portable power bank to $2 per portable power bank causes a 20-unit increase in the quantity of portable power banks demanded, from 20 to 40. For Buyer 2, the price decrease generates a 30-unit increase in the quantity of portable power banks demanded, from 20 to 50. Thus, for the two buyers combined, there is a 50-unit increase in the total quantity demanded, from 40 units to 90 units.
3-15. In Figure 3-2, what are the effects of a price increase from $1 per portable power bank
to $3 per portable power bank on the quantities demanded by buyer 1 and by buyer 2 individually and combined?
For Buyer 1, the price increase from $1 per portable power bank to $3 per portable power bank causes a 20-unit decrease in the quantity of portable power banks demanded, from 50 to 30. For Buyer 2, the price increase generates a 20-unit decrease in the quantity of portable power banks demanded, from 60 to 40. Thus, for the two buyers combined, there is a 40-unit decrease in the total quantity demanded, from 110 units to 70 units.
3-16. In figure 3-4, the current position of the demand curve is D1, and the price of a portable power bank is $3. If there is an increase in the price of tablet devices that are complements to portable power banks, will the demand curve shift to D2 or to D3? What is the change in the amount of portable power bank demanded?
The increase in the price of tablet devices that are complements to portable power banks causes a leftward shift in the demand for portable power banks, from D1 to D3. At the price of $3 per portable power bank, the amount of portable power banks demanded decreases by 2 million units, from 6 million units to 4 million units.
3-17. In figure 3-4, the current position of the demand curve is D1, and the price of a portable power bank, which is a normal good, is $3. If there is an increase in consumer incomes, will the demand curve shift to D2 or to D3? What is the change in the amount of portable power banks demanded?
The increase in consumer incomes generates a rightward shift in the demand curve, from D1 to D2. At the price of $3 per portable power bank, the amount of portable power banks demanded increases by 4 million units, from 6 million units to 10 million units.
3-18. In Figure 3-7, what are the effects of a price decrease from $5 per portable power bank to
$3 per portable bank on the quantities supplied by supplier 1 and by supplier 2 individually and combined?
For Supplier 1, the price decrease from $5 per portable power bank to $3 per portable power bank causes a 20-unit decrease in the quantity of portable power banks demanded, from 55 to 35. For Supplier 2, the price decrease generates a 15-unit decrease in the quantity of portable power banks demanded, from 35 to 20. Thus, for the two buyers combined, there is a 35-unit decrease in the total quantity demanded, from 90 to 55.
3-19. In Figure 3-7, what are the effects of a price increase from $2 per portable power bank to
$4 per portable power bank on the quantities supplied by supplier 1 and by supplier 2 individually and combined?
For Supplier 1, the price increase from $2 per portable power bank to $4 per portable power bank causes a 15-unit increase in the quantity of portable power banks demanded, from 25 to 40. For Supplier 2, the price increase generates a 15-unit increase in the quantity of portable power banks demanded, from 15 to 30. Thus, for the two buyers combined, there is a 30-unit decrease in the total quantity demanded, from 40 to 70.
3-20. In Figure 3-9, the current position of the supply curve is S1, and the price of a portable power bank is $3. If suppliers anticipate a higher price of portable power banks in the future, will the supply curve shift to S2 or to S3? What is the change in the amount of portable power banks supplied?
The increase in the anticipated future price of portable power banks induces suppliers to withhold from the market part of their current supply, which causes a leftward shift in the supply curve for portable power banks, from S1 to S3. At the price of $3 per portable power bank, the amount of portable power banks supplied decreases by about 3 million units, from 6 million units to about
3 million units.
3-21. In Figure 3-9, the current position of the supply curve is S1, and the price of a portable power bank is $3. If the cost of inputs that suppliers utilize to produce portable power banks decreases, will the supply curve shift to S2 or to S3? What is the change in the amount of portable power banks supplied?
The decrease in the cost of inputs used to produce portable power packs causes a rightward shift
in the supply curve for portable power banks, from S1 to S2. At the price of $3 per portable power bank, the amount of portable power banks supplied increases by about 3 million units, from
6 million units to about 9 million units.