Transcript
Active Learning Exercises for Chapter 4: Demand, Supply, and Equilibrium
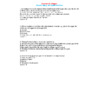
1. (Shifting the Demand Curve; Shifting the Supply Curve; Supply and Demand in Equilibrium; Curve Shifting in Competitive Equilibrium) Consider the market for airlines and assume that it is a perfectly competitive market. Assume the U.S. domestic market is currently at equilibrium with a total of 642 million ticketed passengers per year at a price of $375 per ticket. (You can find these statistics on the website of the United States Department of Transportation’s Bureau of Transportation Statistics). Suppose a study is released that documents large negative health effects of increased exposure to radiation from flying. In addition, suppose there is a sudden increase in the price of jet fuel. If you were asked by a newspaper to comment on these developments, would you predict that the average price per ticket would increase or decrease or that we would be unable to be certain? Would you predict that the number of ticketed passengers would increase or decrease or that we would need additional information?
Solution: See graph below. The study on the negative health effects would reduce demand (shown in the graph as the shift from D1 to D2). The increase in jet fuel would reduce supply (shown in the graph as the shift from S1 to S2). The shifts in the demand and the supply curve are both pushing the equilibrium quantity down, and therefore we know the equilibrium quantity will decrease. However, the shift in the demand curve is pushing the equilibrium price down, and the shift in the supply curve is pushing the equilibrium price up. We would need addition information to predict the direction of the change in the equilibrium price.
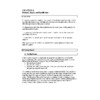
2. (Shifting the Demand Curve; Shifting the Supply Curve; Supply and Demand in Equilibrium; Curve Shifting in Competitive Equilibrium) The Super Bowl in 2014 was held outdoors in New Jersey in the winter. Assume the market for tickets to the event was in equilibrium one week prior to the Super Bowl. A weather report forecasted cold weather for the event, and the price for outdoor seats fell. On one website the prices fell from $2,233 to $1,395 per ticket. The price for club seats that included access to a heated area did not change during the week before the event. Show the effect of the weather report in a graph.
Solution: See graph below. The weather report likely reduced the attractiveness of sitting outside and watching the game; therefore, the demand curve shifted to the left. The equilibrium price for the tickets fell.
3. (Supply and Demand in Equilibrium; Government Interference in Markets) Suppose the following information is gathered for the market for T-shirts in the town where you go to school:
Price Quantity Demanded Quantity Supplied
$2.00 5,000 0
$4.00 4,500 2,000
$6.00 3,800 2,500
$8.00 3,000 3,000
$10.00 2,000 3,250
$12.00 1,000 3,500
$14.00 0 3,700
A. What is the current equilibrium price and equilibrium quantity?
B. Suppose college students rallied and convinced the local government to make it a law that the highest legal price for T-shirts should be $4.00. Would the market be in equilibrium?
Solution: Part A: The equilibrium price and equilibrium quantity occur at the price where the quantity demanded is equal to the quantity supplied. The equilibrium price is $8.00 and the equilibrium quantity is 3,000 T-shirts.
Part B: The market would not be in equilibrium if the price is not allowed to rise above $4.00. Buyers would want to purchase 4,500 T-shirts, but the stores would only be willing to supply 2,000 t-shifts.
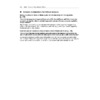
4. (Shifting the Demand Curve; Shifting the Supply Curve; Supply and Demand in Equilibrium; Curve Shifting in Competitive Equilibrium) An article in the Financial Times on January 28, 2011 discussed the price of oil. One issue cited was the political tension in Egypt surrounding the protests that eventually led to the removal of President Hosni Mubarak from power. Due to potential problems in the Suez Canal, some oil was shipped around the southern tip of Africa instead, a much longer (and costlier) trip for the oil tankers. Use a demand and supply graph to show the effect of the political tension on the market for oil. What has happened to the equilibrium price? What has happened to the equilibrium quantity?
Solution: See graph below. The longer trip for the oil tankers increases the transportation costs of the oil, an input into the production of the product. Therefore, the supply curve shifts to the left. The equilibrium price increases, and the equilibrium quantity decreases.
5. (Shifting the Demand Curve; Shifting the Supply Curve; Supply and Demand in Equilibrium; Curve Shifting in Competitive Equilibrium) In February of 2014 a large study was published by The British Medical Journal that questioned the value of mammograms for women. The study found that women who only had clinical breast exams had similar death rates from breast cancer as women who had both regular mammograms and clinical breast exams. What is the likely effect of the publicity of this study on the demand for mammograms? Show your answer in a graph.
Solution: See graph below. The study will likely alter the tastes and preferences of some women. As a result, demand for mammograms will decrease and the demand curve will shift to the left. The equilibrium price will decrease, and the equilibrium quantity will decrease.