Transcript
56Miller• Economics Today, Nineteenth Edition
Chapter 4Extensions of Demand and Supply Analysis57
Chapter 4
Extensions of Demand and Supply Analysis
Overview
The chapter begins by presenting an overview of the price system. There is a discussion of exchange and markets, transaction costs, and the role of middlemen. The examination of supply and demand analysis begins by first identifying what happens to equilibrium price and quantity when demand changes with supply constant and then when supply changes with demand constant. The analysis is pursued further by examining the effects of simultaneous changes in supply and demand. The fact that changes in equilibrium usually take time, in practice, is addressed, and that prices may not even be equilibrium ones for quite some time in a free market is explained. The concepts of rationing by price, waiting, lotteries, and coupons are discussed. Supply and demand analysis is used to show the consequences of government price controls both in an abstract sense and in the specific cases of black markets, rent controls, price supports, and the minimum wage. Finally, the fact that the government places quantity restrictions on a market, by banning goods or imposing import quotas, is discussed.
Learning Objectives
After studying this chapter students should be able to:
4.1 Discuss the essential features of the price system
4.2 Evaluate the effects of changes in demand and supply on the market price and equilibrium quantity
4.3 Understand the rationing function of prices
4.4 Explain the effects of price ceilings
4.5 Explain the effects of price floors and government-imposed quantity restrictions
Outline
I. The Price System and Markets: An economic system in which relative prices constantly change
to reflect changes in demand and supply. Prices act as signals of relative scarcity to persons in the system.
A. Exchange and Markets: Exchanges in markets are voluntary. Voluntary exchange is the act of trading between individuals on a voluntary basis, making both parties subjectively better off. The terms of exchange are usually the price paid and are determined by supply and demand.
B. Transaction Costs: All of the costs associated with exchange, including the informational costs plus the costs of negotiating and enforcing contracts and of acquiring and processing information about alternatives
C. The Role of Middlemen: Middlemen specialize in lowering transaction costs by bringing buyers and sellers together. In our increasingly networked economy, middleman companies called platform firms have been thriving by offering services that connect individuals to others with similar interests or sellers of particular products.
II. Changes in Demand and Supply: Market equilibrium can change when there is a shock caused by a change in the ceteris paribus conditions for demand or supply. A shock can be represented by a shift in the supply curve, the demand curve, or both curves.
A. Effects of Changes in Either Demand or Supply: Whenever one curve shifts and the other does not, it is possible to determine what will happen to both price and quantity. When there is an increase in demand with supply stable, equilibrium price and quantity increase. A decrease in demand with supply stable results in an equilibrium price and quantity decrease. When there is an increase in supply with demand stable, equilibrium price falls and the equilibrium quantity rises. A decrease in supply with demand stable results in equilibrium price rises and the equilibrium quantity falls. (See Figure 4-1.)
B. Situations in Which Both Demand and Supply Shift: When both supply and demand curves shift, the outcome is indeterminate for either equilibrium price or equilibrium quantity.
1. Changes of Demand and Supply in the Same Direction: When there is an increase in supply and demand, equilibrium quantity will rise, and when there is a decrease in supply and demand, equilibrium quantity will fall. Price can increase, decrease, or remain the same depending on relative changes in supply and demand.
2. Changes of Demand and Supply in Opposite Directions: In the event of a decrease in demand and increase in supply, equilibrium price will fall. An increase in demand and a decrease in supply will cause the equilibrium price to rise. In these last two situations quantity can increase, decrease, or remain unchanged depending on the relative changes in supply and demand. (See Figure 4-1.)
C. Price Flexibility and Adjustment Speed: When demand increases in a market, a shortage develops and price rises. The shortage can be eliminated quickly or slowly, depending on the characteristics of the market. There are markets where price flexibility may take the form of indirect adjustments, such as by way of hidden payments or quality changes.
III. The Rationing Function of Prices: The synchronization of decisions by buyers and sellers that creates equilibrium is called the rationing function of prices. Prices are indicators of relative scarcity and ration goods to those who are willing to pay the most. First come, first served, political power, physical force, and cultural, religious, and physical differences have been and are being used as rationing methods throughout the world.
1. Rationing by Waiting: Also called rationing by queues, whoever is willing to wait in line the longest obtains the good that is being sold at less than the market clearing price. To calculate the total price we must add the price paid plus the opportunity cost of the time spent waiting.
2. Rationing by Random Assignment or Coupons: Random assignment means being given the good or service by some random selection process. Coupons are used to limit purchases by requiring the consumer to pay a price and give up a coupon.
A. The Essential Role of Rationing: Because of scarcity, it is not possible for everyone to have everything they want. There must be some method of rationing. Rationing by a freely functioning price system is the most efficient because all gains from mutually beneficial trade will be exhausted.
IV. Price Ceilings: The rationing function of prices is often not allowed to operate when government sets price controls called price floors (minimum legal prices) and price ceilings (maximum legal prices).
Price Ceilings and Black Markets: When a price ceiling is below the market-clearing price,
a shortage occurs. The result is fewer exchanges.
1. Nonprice Rationing Devices: Whenever the price system is not allowed to work, nonprice rationing devices will develop to ration the affected goods and services. An obvious example is queuing. (See Figure 4-3.)
2. Black Markets: Typically, an effective price ceiling leads to a black market in which the price-controlled good is sold at an illegally high price.
B. The Policy of Rent Ceilings: Rent control is the placement of price ceilings on rents in particular municipalities.
1. The Functions of Rental Prices
a. Rent Controls and Construction: Rent controls have discouraged the construction of new rental property by depressing the most important long-term determinant of profitability—rent.
b. Effects on the Existing Supply of Housing: When rental rates are held below equilibrium levels, owners cannot recover through rents, the cost of maintenance, repairs, and capital improvements, so owners curtail repairs and maintenance and quality declines. In some cases, buildings are abandoned, or they may be destroyed through arson so the owners can collect insurance.
c. Rationing the Current Use of Housing: Rent controls restrict renter mobility and can cause housing gridlock.
2. Attempts to Evade Rent Ceilings: Property owners will make life unpleasant for tenants or evict them on the slightest pretense to be able to raise rents that can only be changed if tenants change. Tenants try to sublet apartments at fees above their rental payments. Rent courts attempt to prevent or restrict these activities.
3. Who Loses and Who Gains from Rent Ceilings? Property owners are the biggest losers. Other losers are low-income individuals, especially single mothers, finding to find apartments.
4. Why Both Landlords and Some Tenants Lose: Low-income persons lose because of “key money,” an illegal payment charged up front by some landlords, and a reduced amount of housing. Apartment owners have little incentive to take any risk on low-income individuals as tenants.
5. Beneficiaries of Rent Controls: Upper-income tenants who occupy rent-controlled housing gain the most.
V. Price Floors and Quantity Restrictions
A. Price Floors and Price Supports in Agriculture: In 1933, the federal government established a system of price supports for many agricultural products, including wheat, feed grains, cotton, soybeans, and dairy products.
1. Implementing Agricultural Price Supports: The government chooses a support price of an agricultural product and then ensures that its price never falls below the support level. (See Figure 4-4.)
2. An Effective Agricultural Price Floor: When the government sets the support price above the market clearing price, a surplus develops. The government then buys the surplus and stores it or sells it to foreign countries at a reduced price. (See Figure 4-4.)
3. Who Benefits from Agricultural Price Supports? Owners of big farms that produce more output get a large percentage of subsidies. All of the benefits derived from price support subsidies ultimately accrue to landowners on whose land price-support crops can be grown.
a. Keeping Price Supports Alive under a New Name: Congress appeared to intend to end agricultural subsidies by the early 2000s. What Congress actually did was to keep subsidies alive through direct payments to farmers, “marketing loans,” and payments to farmers to plant smaller areas of land.
b. The Main Beneficiaries of Agricultural Subsidies: The government seeks to cap
the annual subsidy payment at $360,000 per year for an individual farmer, but some farmers are able to obtain higher amounts by exploiting regulatory loopholes. Today, 10 percent of U.S. farmers receive more than 70 percent of farm subsidies.
B. Price Floors in the Labor Market: A minimum wage is a wage floor legislated by government below which it is usually illegal to pay workers. The effect is to cause unemployment for some low-skill workers and depressed wages in areas not covered by the minimum wage. (See Figure 4-5.)
1. Minimum Wages in the United States: The federal minimum wage began in 1938 at
25 cents per hour. It was raised to $5.15 in 1997 and rose in steps to $7.25 in 2009. Many states have minimum wages that exceed the federal minimum wage.
2. Economic Effects of a Minimum Wage: When the minimum wage exceeds the market-clearing wage, the quantity of labor supplied exceeds the quantity of labor demanded. There are fewer workers employed at the higher minimum wage, but those who are employed earn a higher than market-clearing wage. (See Figure 4-5.)
a. Explaining the Overall Decrease in Employment: At the minimum wage, the overall decrease in employment is smaller than the excess quantity of labor supplied because additional workers would like to work more hours at the new, higher minimum wage.
b. Summing Up the Effects of an Above-Equilibrium Minimum Wage: On the one hand, the minimum wage raises the wage earnings for those who obtain employment. On the other hand, the minimum wage results in unemployment for others.
C. Quantity Restrictions: Governments can impose quantity restrictions on a market, such
as a ban on ownership or trading of goods (human organs and certain psychoactive drugs).
The most common quantity restrictions in international trade are import quotas. A quota
is a quantity restriction that prohibits the importation of more than a specified quantity of a particular good in a one-year period. The United States has had import quotas on tobacco, sugar, and immigrant labor. The beneficiaries of quotas are importers who get the quota rights and the domestic producers of the restricted good.
Points to Emphasize
Equilibrium Price and Quantity Changes When There Are Changes
in Supply and Demand
When one curve shifts and the other is stable, it is possible to predict what will happen to equilibrium price and quantity. For example, the effect of an increase in demand is to raise equilibrium price and quantity. When both curves shift, the effect on either price or quantity is a priori indeterminate. An increase in supply and demand, for example, leads to an increase in equilibrium quantity. The effect on price depends on the increase in demand relative to supply. If supply increases more than demand, price will fall and vice versa. If both curves shift by the same amount, price will not change at all. Because
real-world markets are constantly experiencing changes in the nonprice determinants of both supply and demand, both curves are constantly shifting.
Adjustment Speed
The graphic presentation of changes in supply and demand often leads to the conclusion that price and quantity adjustments are relatively smooth and rapid. Although this sometimes happens, it is often true that some markets do not get back into equilibrium immediately. All the analysis does is show what equilibrium price and quantity will ultimately be, given a demand curve and a supply curve. An analysis of skilled labor shortages illustrates a situation in which a shortage can persist for a significant period of time. Because skilled labor is relatively fixed in supply in the short run, an increase in demand and the resulting increased wage do not immediately attract qualified new workers. It takes time to train or educate new workers. Because the wage must first rise to attract additional persons, the adjustment time period may be longer than the training period.
Rationing
Different methods exist to ration or allocate an available good or service to people. Pick a scarce good
or service generally viewed as a necessity and ask how to allocate it. Considerable controversy has arisen over how to allocate human organs for transplanting. The current allocation method is essentially a first-come, first-served rationing by queuing system using donated organs from relatives or from people who die. Some living individuals have been willing to sell an organ to the highest bidder. Supply and demand in a free market would assure that a price for organs would be determined that would clear the market, that is, a price that measures the relative scarcity of organs would be established. This is called the rationing function of price. It is important to realize that some people are going to die for lack of organs no matter what system is used because the number of people needing organs greatly exceeds the number of organs available.
In some situations rationing by waiting coexists with price as an allocation device. Price may be deliberately kept below equilibrium, in which case those who are willing to wait longest and pay the below equilibrium price get the good. Emphasize that the actual price paid should include the opportunity cost of time. Queuing is used when there are large or unpredictable changes in demand and high costs
of satisfying demand in the short run, such as at the opening night at a movie theater that is showing
a hit movie.
Price Ceilings
Price controls represent maximum legal prices (price ceilings) and minimum legal prices (price floors). Price ceilings are supposed to protect buyers from high prices. One way to help low-income persons, according to some people, is to keep rents low (price ceiling). This is the reason for rent control, in which some local governments tell landlords how much rent to charge. In fact, just the opposite happens. The number of existing rental units declines, and the remaining ones are poorly maintained. Fewer low-rent units are constructed because their future profitability is questionable. In addition, illegal “key money”
to get into a rent-controlled unit is often too high for the poor. The ultimate effects of a price ceiling
or a price floor are often not the ones intended. Also, price ceilings may have the effect of causing a black market to come into existence. A black market is a market in which the price-controlled good is sold at an illegally high price. The price paid above the controlled price may be in the form of money, favors to the seller by the buyer, or other nonmonetary consideration.
Price Floors
In addition to increasing the unemployment rate among those subject to the minimum wage, the minimum wage results in those unemployed workers losing opportunities to increase their human capital from on-the-job training and work experience. Thus, the minimum wage has the effect of preventing some low-productivity workers from increasing their human capital by enough to qualify for a minimum-wage job.
For Those Who Wish to Stress Theory
The Process of Adjustment
The adjustment process from one equilibrium price and quantity to another can be interesting. The method in the text is one in which a change in supply or demand occurs, and then the final equilibrium
is shown and compared to the initial one. A dynamic adjustment process may be more interesting. The Cobweb Model proposes that sellers respond in the current period to the previous period’s price. The model shows how a market can converge on equilibrium after a series of surpluses and shortages.
When a good’s price is set below equilibrium or is distributed for free, much, perhaps all of it will be distributed by queuing. Yoram Barzel (see Selected References) argues that with price below equilibrium and with no other formal rationing system, equilibrium will be established by people paying the money price and by expending enough resources on getting the good so that the marginal person neither gains nor loses from getting it. Because queuing is the usual method for acquiring this type of good, time is the resource expended. The amount of time spent in the queue is directly related to the size and number of units in a batch being distributed. The actual price paid rises to an equilibrium level equal to the money price paid plus the value of time spent waiting. For the marginal individual, the waiting time plus any price paid uses up the benefits of the lower money price (even a zero price). An important implication of this analysis is that when income redistribution through provision of free or below-equilibrium priced goods is tried, the cost of the good increases through an increase in time needed to get the good.
Further Questions for Class Discussion
1. Because the problems associated with price ceilings are discussed in detail in the text, it is useful to look at the effects of a price floor. Many developing countries have been lobbying at recent meetings of the World Trade Organization for an end to agricultural subsidies by developed countries. Why would these developing countries that also produce many of these same agricultural products wish to have these subsidies ended?
When the U.S. government makes up the difference between the world market price and the price in the United States, then U.S. farmers can sell their crops on the world market and still enjoy a profit from the sales. These subsidies also provide an incentive to farmers to produce more than they would in a free market. The increase in supply in world markets causes the world market price to fall. In many cases, the price falls by enough to make raising these commodities unprofitable in third-world countries because their farmers’ production costs are too high to sell the products at a competitive price on the world market.
2. A major issue in the 2008 presidential campaign in the United States was the high price of gasoline and crude oil. The price of crude oil rose rapidly in 2007 and 2008, despite increases in production
by Organization of Petroleum Exporting Countries (OPEC). Part of the reason is that the Chinese and Indian economies had been growing at very high rates. This growth has fueled demand for energy for industry and transportation. In addition, the rising incomes in these countries have increased the demand for automobiles and thus gasoline as more people in these countries can afford them. The Republicans argue that increased drilling in the offshore areas of the United States would increase the supply of oil and bring the price down. The price of gasoline would decrease as a result. Using supply and demand analysis, explain whether or not it is certain that the price of oil and therefore gasoline would fall if there were successful offshore drilling for oil in U.S. waters. No. The increase in production by OPEC would have increased supply in 2007 and 2008, and the prices of oil and gasoline did not fall to 2006 levels. Thus the increased oil supply from offshore drilling can only be counted on to decrease the price of oil and thus gasoline if it causes the global supply of oil to increase by more than global demand increases.
3. Opponents of legalized marijuana argue that legalizing the drug would result in more marijuana
being consumed. Is this result predicted by the supply and demand model? Yes. Buyers and sellers
of marijuana face costs that buyers and sellers of legal products do not. They face the cost of going
to jail and possible fines with resulting loss of income. Transaction costs are higher for buyers because sellers cannot advertise and sellers cannot legally enforce contracts. Thus, both the demand for and supply curves of marijuana are further to the left (less) than they would be than if marijuana were to be a legal product. Thus, if marijuana were to be legalized, both the supply and demand curves would shift to the right, i.e., would increase. Thus, the equilibrium quantity of marijuana would increase.
4. The text argues that economists can analyze and compare the efficiency of different rationing systems but cannot say which one is best. Doesn’t it seem reasonable to accept that the most efficient system, the price system, is the best? No. As economists we can analyze the operation of rationing systems and say something about how efficient they are relative to each other. To say that one rationing system is the “best” because it is the most efficient requires that a value judgment be made that efficiency is the criterion for determining what is best. Economic analysis uses positive analysis, which identifies “what is.” A determination of “best” is an exercise in positive economics, which identifies what “ought to be.”
5. In 1974, the cutback in oil production by the OPEC cartel created shortages of oil in the world market. In the United States, price controls prevented oil and gasoline prices from rising to world market levels. In Europe and Canada, oil and gasoline prices rose to world market levels. In the United States, lines of cars formed at service stations, while there were no lines in Canada. Why?
In the United States, price was held below the market-clearing level and queuing occurred. The actual cost of gasoline rose to equilibrium levels if one counts the price paid plus the value of time used in waiting as the total cost of gasoline. The Canadians voluntarily cut back on consumption
at the higher money price of gasoline by enough to eliminate the shortage, and no lines formed.
Answers to Questions for Critical Analysis
Online Dating Sites and Virtual Roses (p. 77)
Why do you suppose that online dating companies provide each customer with only a small set of virtual roses to attach to date invitations? (Hint: If people could attach a virtual rose to every invitation they extend, how useful would seeing a rose attachment be to recipients?)
Each customer has only a small number of virtual roses to attach to invitations so that each rose can signal the sender’s higher-than-normal interest to the recipient.
Rationing Water (p. 81)
How might California cities alternatively have developed a rationing by queues approach using the Internet?
Cities might develop a rationing-by-queues approach using the Internet so that water will be provided to residents on a first-come first-served basis at a fixed price.
Looking for Hard-to-Find Items in Venezuela? Ask for the Bachaqueros
(p. 83)
Why do you suppose that the Venezuelan government has begun to provide individuals with coupons giving them the right to purchase only strictly limited qualities of flour, milk, and toilet paper?
Providing individuals with coupons to purchase strictly limited quantities of items would help eliminate the existence of a black market because purchases of those goods now become impossible without the coupons.
Dramatic Responses to Cities’ Minimum Wage Hikes: “Zeroing Out” Employment (pp. 88?89)
When firms respond to minimum wage increases by shutting down entirely, who else is harmed besides their employees? (Hint: During a West Coast trip, would it now be possible for you to buy lunch at Z Pizza in Seattle or to purchase dinner at the Abbot’s Cellar in San Francisco?)
When those firms shut down, they reduce the amount of supply in their markets. As a consequence, potential customers of those firms are also harmed.
The European Union Decides That the Costs of Milk Quotas Outweigh the Benefits (p. 89)
Other things being equal, is the price of milk in Europe likely to rise or fall in response to the elimination of milk production quotas? Explain your answer.
The elimination of milk production quotas effectively increases the amount of quantity supplied in the European market for milk. As a result, the price of milk will fall.
You Are There
Price Rationing via Changes in the Number of Items Sold in a Package (p. 90)
1. How do you suppose that when soft drink sellers introduced cans containing 7.5 ounces of soft drink to sell alongside traditional 12-ounce cans, they managed to offer the soft drinks in the smaller cans at prices that were several cents higher per ounce of soft drink?
Despite the fact that the prices of soft drinks in smaller cans are higher per ounce of soft drink, consumers who prefer to consume the smaller amounts of soft drink would actually prefer the smaller cans so that they would not need to pay for the excess amounts of soft drink in the larger cans.
2. Why do you think that most economists seek to study prices measured in terms of dollars per unit as measured, say, by weight or by volume rather than by prices per package or per container? Explain your reasoning.
Economists study prices measured in terms of dollars per unit because consumers compare the relative prices of goods and services, and the per-unit price makes it possible for consumers to accurately compare the price of one good with the price of another good.
Issues & Applications
Online Middlemen: Customer Sales Reps Move to the Web (pp. 90–91)
1. Why might transaction costs of locating a replacement clothing item increase with the number of particular features that characterize that item?
When the number of particular features of a replacement clothing item increases, the information that consumers must obtain to verify a clothing item’s features increases. This increase in information needed means more transaction costs for consumers to locate the desired replacement clothing item.
2. It is obvious how finding a provider of cabinet-installation services can reduce a consumer’s transaction costs, but how can middlemen such as Amazon also reduce transaction costs for providers of such services?
Amazon reduces transaction costs for providers of cabinet-installation services by matching consumers to service providers. Without Amazon’s services, those providers would have to search for consumers themselves.
Research Project
1. Take a look at Amazon’s description of its Home Services offerings in the Web Links in MyEconLab.
2. Learn about the middleman structure of the Operator network in the Web Links in MyEconLab.
Appendix B—Consumer Surplus, Producer Surplus, and Gains from Trade within a Price System
Consumer Surplus: The difference between the total amount that consumers would have been willing to pay for an item and the total amount that they actually pay. (See Figure B-1.)
A. Willingness to Pay (See Figure B-1.)
1. Graphing Consumer Surplus (See Figure B-1.)
Producer Surplus: The difference between the total amount that producers actually receive for an item and the total amount that they would have been willing to accept. (See Figure B-2.)
A. Willingness to Sell (See Figure B-2.)
1. Graphing Producer Surplus (See Figure B-2.)
Gains from Trade within a Price System: The sum of consumer surplus and producer surplus. (See Figure B-3)
Price Controls and Gains from Trade: Price ceilings or price floors reduce gains from trade.
Answers to Problems
4-1. In recent years, technological improvements have greatly reduced the costs of producing basic cell phones, and a number of new firms have entered the cell phone industry. At the same time, prices of substitutes for cell phones, such as smartphones and some tablet devices, have declined considerably. Construct a supply and demand diagram of the market for cell phones. Illustrate the impacts of these developments, and evaluate the effects on the market price and equilibrium quantity.
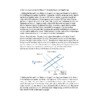
The ability to produce basic cellphones at lower cost and the entry of additional producers shift the supply curve rightward, from S1 to S2. At the same time, reduced prices of substitute smartphones result in a leftward shift in the demand for cellphones, from D1 to D2. Consequently, the equilibrium price of basic cellphones declines, from P1 to P2. The equilibrium quantity may rise, fall, or as shown in the diagram, remain unchanged.
4-2. Advances in research and development in the pharmaceutical industry have enabled manufacturers to identify potential cures more quickly and therefore at lower cost. At the same time, the aging of our society has increased the demand for new drugs. Construct a supply and demand diagram of the market for pharmaceutical drugs. Illustrate the impacts of these developments, and evaluate the effects on the market price and the equilibrium quantity.
The ability to produce drugs at lower cost leads to an increase in the market supply of drugs, so
the supply curve shifts rightward. At the same time, the increased demand for drugs by an aging population shifts the market demand curve rightward. Thus, the equilibrium quantity of drugs increases, but the market clearing price may rise, fall, or remain unchanged (as shown).
4-3. There are simultaneous changes in the demand for and supply of global-positioning-system (GPS) devices, with the consequences being an unambiguous increase in the market clearing price of these devices but no change in the equilibrium quantity. What changes in the demand for and supply of GPS devices could have generated these outcomes? Explain.
An increase in demand for GPS devices and an accompanying reduction in supply of GPS devices could result in an unambiguous increase in the market clearing price but no change in the equilibrium quantity.
4-4. There are simultaneous changes in the demand for and supply of tablet devices, with the consequences being an unambiguous decrease in the equilibrium quantity of these devices but no change in the market clearing price. What changes in the demand for and supply of tablet devices could have generated these outcomes? Explain.
A simultaneous decrease in the demand for tablet devices and accompanying reduction in the supply of tablet devices could result in an unambiguous decrease in the equilibrium quantity of these devices but no change in the market clearing price.
4-5. The following table depicts the quantity demanded and quantity supplied of studio apartments in a small college town.
Quantity Quantity
Monthly Rent Demanded Supplied
$600 3,000 1,600
$650 2,500 1,800
$700 2,000 2,000
$750 1,500 2,200
$800 1,000 2,400
What are the market price and equilibrium quantity of apartments in this town? If this town imposes a rent control of $650 per month, how many studio apartments will be rented?
The market rental rate is $700 per apartment, and the equilibrium quantity of apartments rented to tenants is 2,000. At a ceiling price of $650 per month, the number of apartments students desire to rent increases to 2,500 apartments. At the ceiling price, the number of apartments that owners are willing to supply decreases to 1,800 apartments. Thus, there is a shortage of 700 apartments at the ceiling price, and only 1,800 are rented at the ceiling price.
4-6. Suppose that the government places a ceiling on the price of a medical drug below the equilibrium price.
a. Show why there is a shortage of the medical drug at the new ceiling price.
b. Suppose that a black market for the medical drug arises, with pharmaceutical firms secretly selling the drug at higher prices. Illustrate the black market for this medical drug, including the implicit supply schedule, the ceiling price, the black market supply and demand, and the highest feasible black market price.
a. At the ceiling price of the medical drug, P1, the quantity of the drug demanded exceeds the quantity of the drug legally supplied by pharmaceuticals firms, so there is a shortage of the drug.
b. If a black market develops, then the implicit supply curve is S1, and the black market price will end up between P1 and P2. The highest feasible black market price is P2.
4.7. The table below illustrates the demand and supply schedules for seats on air flights between two cities:
Quantity Quantity
Price Demanded Supplied
$200 2,000 1,200
$300 1,800 1,400
$400 1,600 1,600
$500 1,400 1,800
$600 1,200 2,000
What are the market price and equilibrium quantity in this market? Now suppose that federal authorities limit the number of flights between the two cities to ensure that no more than 1,200 passengers can be flown. Evaluate the effects of this quota if price adjusts.
(Hint: What price per flight are the 1,200 passengers willing to pay? See page 95.)
The market price is $400, and the equilibrium quantity of seats is 1,600. If airlines cannot sell tickets to more than 1,200 passengers, then passengers are willing to pay $600 per seat. Normally airlines would be willing to sell each ticket for $200, but they will be able to charge a price as high as $600 for each of the 1,200 tickets they sell. Hence, the quantity of tickets sold declines from 1,600, and the price of a ticket rises from $400 to as high as $600.
4-8. The consequences of decriminalizing illegal drugs have long been debated. Some claim that legalization will lower the price of these drugs and reduce related crime and that more people will use these drugs. Suppose some of these drugs are legalized so that anyone may sell them and use them. Now consider the two claims—that price will fall and quantity demanded will increase. Based on positive economic analysis, are these claims sound?
The fact that drug sellers incur legal penalties if caught means that there is an extra cost of
selling drugs over and above those associated with production and distribution of these substances. Legalization would eliminate these costs and cause the market supply curve to shift rightward. This would indeed reduce the market price and increase the equilibrium quantity. To the extent that drug users commit crimes to fund currently high-market prices, drug legalization could indeed reduce the incentive for such criminal activities. At the same time, to the extent that drug use causes a national health problem, increased use of legalized drugs could expand the scope of that problem. Thus, both sides have potentially legitimate points.
4-9. In recent years, the government of Pakistan has established a support price for wheat of
about $0.20 per kilogram of wheat. At this price, consumers are willing to purchase 10 billion kilograms of wheat per year, while Pakistani farmers are willing to grow and harvest 18 billion kilograms of wheat per year. The government purchases and stores all surplus wheat.
a. What are annual consumer expenditures on the Pakistani wheat crop?
b. What are annual government expenditures on the Pakistani wheat crop?
c. How much, in total, do Pakistani wheat farmers receive for the wheat they produce?
a. Consumers buy 10 billion kilograms at the support price of $0.20 per kilogram and hence spend $2 billion on wheat.
b. The amount of surplus wheat at the support price is 8 billion kilograms, so at the $0.20-per-kilogram support price, the government must spend $1.6 billion to purchase this surplus wheat.
c. Pakistani wheat farmers receive a total of $3.6 billion—the sum of the $2 billion in consumers’ purchases and the $1.6 billion of the government’s purchases—for the wheat they produce at the support price.
4-10. Consider the information in Problem 4-9 and your answers to that question. Suppose that
the market-clearing price of Pakistani wheat in the absence of price supports is equal to
$0.10 per kilogram. At this price, the quantity of wheat demanded is 12 billion kilograms. Under the government wheat price-support program, how much more is spent each year
on wheat harvested in Pakistan than otherwise would have been spent in an unregulated market for Pakistani wheat?
In the absence of price supports, consumers would have bought 12 billion kilograms of wheat at the market price of $0.10 per kilogram, thereby spending $1.2 billion. Hence, under the government’s price support program, wheat farmers in Pakistan are receiving $2.4 billion more for wheat than they would have in the absence of the price support.
4-11. Consider the diagram below, which depicts the labor market in a city that has adopted a “living wage law” requiring employers to pay a minimum wage rate of $11 per hour. Answer the questions that follow.
a. What condition exists in this city’s labor market at the present minimum wage of
$11 per hour? How many people are unemployed at this wage?
b. A city councilwoman has proposed amending the living wage law. She suggests reducing the minimum wage to $9 per hour. Assuming that the labor demand and supply curves were to remain in their present positions, how many people would be unemployed at a new $9 minimum wage?
c. A councilman has offered a counterproposal. In his view, the current minimum wage is too low and should be increased to $12 per hour. Assuming that the labor demand and supply curves remain in their present positions, how many people would be unemployed at a new $12 minimum wage?
a. At the present minimum wage of $11 per hour, the quantity of labor supplied is 102,000 workers, and the quantity of labor demanded by firms is 98,000. There is an excess quantity supplied of 4,000 workers, which is the number of people who are unemployed.
b. At a minimum wage of $9 per hour, there would be nothing to prevent market forces from pushing the wage rate to the market clearing level of $10 per hour. This $10-per-hour wage rate would exceed the legal minimum and hence would prevail. There would be no unemployed workers.
c. At a $12-per-hour minimum wage, the quantity of labor supplied would increase to
104,000 workers, and the quantity of labor demanded would decline to 96,000. There would be an excess quantity of labor supplied equal to 8,000 workers, which would then be the number of people unemployed.
4-12. A city has decided to impose rent controls, and it has established a rent ceiling below the previous equilibrium rental rate for offices throughout the city. How will the quantity of offices leased by building owners change?
The reduction in the allowable rental rate, or price of rental offices, reduces the quantity of offices that owners are willing to supply. Hence, the quantity of offices leased to tenants declines.
4-13. In 2013, the government of a nation established a price support for wheat. The government’s support price has been above the equilibrium price each year since, and the government has purchased all wheat over and above the amounts that consumers have bought at the support price. Every year since 2013, there has been an increase in the number of wheat producers in the market. No other factors affecting the market for wheat have changed. Predict what has happened every year since 2013, to each of the following:
a. Amount of wheat supplied by wheat producers
b. Amount of wheat demanded by all wheat consumers
c. Amount of wheat purchased by the government
a. The rise in the number of wheat producers causes the market supply curve to shift rightward, so more wheat is supplied at the support price.
b. The quantity of wheat demanded at the same support price is unchanged.
c. Because quantity demanded is unchanged while quantity supplied has increased, the amount of surplus wheat that the government must purchase has risen.
4-14. In advance of the recent increase in the U.S. minimum wage rate, the government of the state of Arizona decided to boost its own minimum wage by an additional $1.60 per hour. This pushed the wage rate earned by Arizona teenagers above the equilibrium wage rate in the teen labor market. What is the predicted effect of this action by Arizona’s government on each of the following?
a. The quantity of labor supplied by Arizona teenagers
b. The quantity of labor demanded by employers of Arizona teenagers
c. The number of unemployed Arizona teenagers
a. The quantity of labor supplied by Arizona teenagers increases.
b. The quantity of labor demanded by employers of Arizona teenagers decreases.
c. There is an increase in the excess quantity supplied in the Arizona market for teen labor, so the number of unemployed Arizona teenagers increases.
4-15. Consider Figure 4-1. The current demand and supply curves are D1 and S1, at which the equilibrium price and quantity are P1 and Q1. If there is a decrease in the price of an item that consumers regard as a substitute for this good, which curve shifts, and in which direction does it shift? What happens to the market clearing price and to the equilibrium quantity?
A decrease in the price of an item that consumers regard as a substitute for this good causes the demand curve for this good to shift leftward, as shown in panel (b) by the leftward shift from D1 to D3. Consequently, there is a movement from equilibrium point E1 to equilibrium point E3 in panel (b). The market clearing price decreases, from P1 to P3, and the equilibrium quantity decreases, from Q1 to Q3.
4-16. Consider Figure 4-1. The current demand and supply curves are D1 and S1, at which the equilibrium price and quantity are P1 and Q1. If firms adopt an improved technique for producing this goods, which curve shifts, and in which direction does it shift? What happens to the market clearing price and to the equilibrium quantity?
A technological improvement causes the supply curve for this good to shift rightward, as shown in panel (c) by the rightward shift from S1 to S2. Consequently, there is a movement from equilibrium point E1 to equilibrium point E2 in panel (c). The market clearing price decreases, from P1 to P2, and the equilibrium quantity increases, from Q1 to Q2.
4-17. Consider Figure 4-3. Suppose that the government reduces the ceiling price to $500 per unit. Would the shortage at the $500-per-unit ceiling price be greater than at the $600-per-unit price ceiling?
The reduction in the ceiling price from $600 per unit to $500 per unit would generate a decrease in the quantity supplied and an increase in the quantity demanded. Consequently, the amount of the excess quantity demanded, or shortage, would increase to an amount exceeding 10,000 units.
4-18. Suppose that in Figure 4-4, the government raises the floor price of milk above the displayed $0.10-per-pound floor price, to $0.12 per pound. Will the excess quantity of milk supplied increase or decrease as a consequence?
An increase in the floor price from $0.10 per pound to $0.12 per pound will cause the quantity of milk demanded to fall and the quantity of milk supplied to rise. Hence, the excess quantity of milk supplied will increase.
4-19. Suppose that in Figure 4-4, the government reduces the floor price of milk below the displayed $0.10-per-pound floor price, to $0.08 per pound. Will the excess quantity of milk supplied increase or decrease as a consequence?
A decrease in the floor price from $0.10 per pound to $0.08 per pound will result in in an increase in the quantity of milk demanded, from 15 billion pounds to 15.4 billion pounds, and a decrease in the quantity of milk supplied, from 16 billion pounds to 15.4 billion pounds. Thus, the excess quantity supplied decreases to zero.
4-20. Suppose that Figure 4-5 applies to the labor market in the state of Ohio, in which Wm is the minimum wage established by the federal government, and Qs – Qd therefore is Ohio’s excess quantity of labor supplied as a result of the federal wage minimum. What would happen to Ohio’s excess quantity of labor supplied if the state were to decide to establish its own minimum wage at a level above the federal minimum?
If Ohio were to set a statewide minimum wage higher than the federal minimum Wm, the quantity
of labor demanded would decrease, and the quantity of labor supplied would increase. Thus, the amount of the excess quantity of labor supplied in Ohio would increase.
Selected References
Barzel, Yoram, “A Theory of Rationing by Waiting,” Journal of Law and Economics, April 1974,
pp. 73–95.
Boulding, Kenneth E., Economic Analysis, Vol. 1 Microeconomics, New York: Harper & Row, 1966.
Friedman, Milton, Capitalism and Freedom, The Heritage Foundation, 1962.
©2018 Education, Inc.
©2018 Education, Inc.
©2018 Education, Inc.