Transcript
Module 5 – The Market
5.1 Introduction
A market exist when individuals, households and firms who want to buy a good or services are in contact with firms or institutions willing to supply that good or service (or resource)
Market prices provide information to buyers attempting to maximize utility from their allocation of their budgets and also to suppliers attempting to maximize their profits
5.2 Market Supply and Demand
For an exchange to take place, there must be at least one common price at which suppliers would be willing to sell a quantity of the good and at which individuals would be prepared to buy a quantity of the good
1631951841500
1631951333500016319545974000175260045720Supply
00Supply
P2
3810005270500
P1
144780043815005988052159000
168719540005Demand
00Demand
1631958826500
Q1 Q2
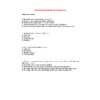
At price P1, consumers would be willing to buy quantity Q1 while suppliers would supply Q2
At price P2, no exchange could take place because the demand would be zero
Any consumer willing to buy a good at P1 must prefer the good to the cash P1, similarly any supplier supply the good at P1 must prefer the cash than the good
125095068580Supply
00Supply
107959144000
20701012001500
25019012954000
107759526035Demand
00Demand
1079512700000
Exchange is not possible in the above market because there is no common price at which exchange could occur
1906270128270Supply
00Supply
16510063500Demand
00Demand
20701013970000323853048000
14262108699500
546104699000107956858000
The above is the market demand and supply for fresh air – this is a free good because for every quantity demanded, the suppliers are willing to supply for free. The supply curve eventually turns up because if you wanted more you would have to install air conditioning of some sort
Where the demand curve cuts the supply curve is where there is neither excess supply nor demand in the market
5.3 Operation of Markets
If a price causes excess supply or demand in the market, forces in the market will change the price of the good and the quantity bought and sold until the market is in equilibrium
Excess demand causes prices rises causes less demand
Excess supply causes price reduction causes less supply
The equilibrium price is the price that allows all individuals who wish to buy a good obtain as much as they wish to at that price, and enables all suppliers who wish to sell the good sell as much as they wish to at that price – the quantity that is bought/sold is called the equilibrium quantity
Consumer Surplus is the difference between the price individuals actually pay for a good and the price they would be willing to pay
10858512890500
1092207683500B
103568534925E
00E
130810190500
1132205117475008699513906500A
869951206500
At least on individual is willing to pay price B, but they only have to pay A if this market is in equilibrium, the consumer surplus is measures by the triangle BAE
Similarly producers surplus is the difference between the price suppliers actually receive for selling units and the lower prices they would be willing to accept
10858512890500
1092207683500
103568534925E
00E
130810190500
1132205117475008699513906500A
C
869951206500
AEC is the producers surplus at the equilibrium price of A
Information in markets is very important, once the terms of exchanges become known by buyers and suppliers then the market moves to equilibrium
5.4 Changes in Market Equilibrium
If a market were in equilibrium and any of the conditions effecting supply or demand were to change, forces would establish a different equilibrium price and/or quantity
An increase in demand due to a rise in the price of a substitute good would shift the demand curve up and so increase the equilibrium price and quantity, cet. par.
Very important:
An increase in demand refers to a shift in the demand curve
An increase in the quantity demanded refers to movement along the existing demand curve
…..Similarly with supply
An increase in supply would cause the supply curve to shift to the right and cause the equilibrium price to reduce while the quantity would increase
When an increase in supply and demand occurs simultaneously, the new equilibrium quantity is always higher but whether the price is higher or lower depends on the relative shift of the two curves
If the demand increased and the supply decreased, the price will always increase but the quantity may increase or decrease
If supply increase and demand decreases, the price will fall but quantity may rise or fall
If demand and supply falls, quantity would fall but price may rise or fall
Supply increase Supply unchanged Supply Decrease
Demand Increases Q higher P & Q higher P higher
Demand unchanged P lower no change P higher, Q lower
Demand decreases P lower P lower, Q lower Q lower
Note:
A decrease in supply could be caused by an increase in production costs – this would mean supply curve shifts to the left, ie a supplier is willing to supply less goods for the same price
5.5 Intervention in the Market
Market intervention or market regulation occurs where a non-market force causes the price and quantity of a good bought and sold in a competitive market to be different from the price/quantity combination that would occur if the market were allowed to operate freely
When the price of a good is fixed below the equilibrium level, a price ceiling is said to exist in the market for that good
Price alone will not be sufficient to allocate supply – rationing or ‘first come first served’ could be used
2159012636500
71818523495S
00S
6096002349500
21590825500
21590-63500113220564135D
00D
P1
11322051035050009271000
P2
215906159500
S1 S2
Lets say supply is limited to S1 (supply inelastic)
If the market were left to its own devices, the equilibrium price would be P1
Lets say the organizers of this event feel P1 is to high and set the ceiling price at P2
Demand is for S2 tickets but only S1 are available and so some mechanism needs to be in place to allocate the S1 tickets
Black markets spring up when price ceilings are in place – they attempt to force the price back to equilibrium level
A black market can exist in the above example because there is demand at prices above P2 for tickets
When the price of a good is fixed above equilibrium level, a price floor is said to exist in the market for that good
Excess supply will exist and some method other than price needs to be in place so the surplus can be disposed of
The EU’s system of setting prices for agricultural goods is an example of this
438153238500
47879060960004572003873500
67500599695004381511049000 P1
4381510160000 Pe
215902476500
S1
If the price of a good is set at P1 (>Pe) then producers will supply an excess quantity for the market as supply will be greater than demand
The surplus could be destroyed, stockpiled or the govt could pay the farmers to produce no more than S1
Minimum wage causes some low skilled people to be unemployed because the supply will be greater then demand
5.5.3 Taxes and Subsidies
If a tax of $1 is imposed on suppliers of a particular good, then the MC increases by $1 and so the market supply curve will shift upwards by $1 – the demand curve would remain the same
How much this tax effects the new equilibrium price depends on the elasticity of the demand curve – the more elastic (horizontal) the less the price will increase due to the tax and so the more the firm would have to absorb the tax
The imposition of a tax would cause the consumer and producer surpluses to be reduced
5.6 Dynamic Adjustments to the Market
The analysis of the change in equilibrium points due to a shift in market curves is called ‘comparative statics’
This does not take into account the time necessary for a new equilibrium to be established, nor does it trace the exact process by which a market adjusts from one point to another
When the demand for a good changes, price will reach different levels in different time periods depending on differences in the supply elasiticity
During the market period, the supply curve may be completely inelastic because quantity supplied cannot be altered no matter how the demand curve changes
So during the market period, the price will change dramatically in response to changes in demand
5.6.1 The Effect of Changes in the Short Run
The supply of the good is more elastic in the short run as opposed to the market period – so equilibrium price will not change with a change in demand but not as much
5.6.2 The Effect of Changes in the Long Run
Supply is more elastic than in short run and hence changes in the demand curve produce less dramatic changes in price
If the long run supply curve is completely elastic, price would return to its original equilibrium point after a demand curve shift and the equilibrium quantity would change dramatically
5.6.3 Cyclical patterns in markets
For markets whose supply of goods and resources changes only after a time lag, the prices for those goods and resources tends to fluctuate in a cyclical fashion
654059779000
848995171450054419510414000
654051320800080581513208000 P1
78359082550018503902984500
8699512319000117538512319000 P3
1545590-1270001110615-63500 P
13931905080008699550800013500107048500
109918512065000 P2
1850390400050065405-3810001110615-381000
654054318000
Q1 Q3 Q Q2
Farmers are originally at equilibrium at price P and quantity Q but due to foot and mouth they produce Q1 the next year
Farmers produce Q1 pigs and get price P1 for them – encouraged by the high price they increase their supply for next year, using P1 as a guide they produce Q2
To clear Q2 from the market, they have to accept P2
This cyclical price movement goes on until they once again achieve equilibrium
In some markets the price does not converge to equilibrium but in fact moves away
This occurs in markets where the supply curve is steeper than the demand
The cobweb model assumes that producers never learn from experience and that there are no speculators
Remember:
An increase in the supply (e.g. due to a reduction in production cost) means the supply curve moves to the right
An increase in demand (e.g due to an increase in the cost of a substitute good) means the demand curve moves to the right.
The more a curve is horizontal the more elastic it is
Review Qs:
d
b
b
b
a
b
a
a
d
c
c
b


")

")


")


")


