|
|
A free membership is required to access uploaded content. Login or Register.
IB 1108 L06 Diffusion
|
|
Uploaded: 3 years ago
Category: Biology
Type: Lecture Notes
Rating:
N/A
|
Filename: IB_1108_L06_Diffusion.docx
(793.24 kB)
Page Count: 7
Credit Cost: 2
Views: 69
Last Download: N/A
|
Transcript
Pre-Lab Questions
A concentration gradient affects the direction that solutes diffuse. Describe how molecules move with respect to concentration.
Solute molecules move from a region of higher concentration, which is called diffusion.
How does the size of a solute affect the rate of diffusion? Consider the size and shape of a molecule in your response.
The size of the solute molecule and the rate of diffusion are inversely proportional. Which means that the bigger the size of the solute, the slower the rate of diffusion will be.
Does polarity affect the rate of diffusion? Explain your answer using scientific principles.
Polarity of solute has a negative effect on diffusion of molecular solvents like water and other solutions.
Experiment 1: Diffusion Through A Liquid
Result Tables
Table 1: Rate of Diffusion in Corn Syrup
Time (sec)
Blue Dye
Red Dye
10
7mm
14mm
20
10mm
15mm
30
11mm
17mm
40
12mm
18mm
50
12mm
20mm
60
13mm
21mm
70
15mm
23mm
80
16mm
25mm
90
16mm
25mm
100
16mm
26mm
110
17mm
26mm
120
17mm
26mm
Table 2: Speed of Diffusion of Different Molecular Weight Dyes
Dye
Molecular Weight
Total Distance Traveled (mm)
Speed of Diffusion (mm/hr.)*
Blue Dye
793g/m
250mm
7500mm/hr
Red Dye
496g/m
156mm
4680mm/hr
*Multiply the total distance diffused by 30 to get the hourly diffusion rate.
Post-Lab Questions
Record your hypothesis from Step 3 here. Be sure to support your hypothesis with evidence.
The temperature of the water increases then the rate of diffusion will increase. If the temperature of the water decrease, then the rate of diffusion will decrease.
Which dye diffused the fastest?
The red dye diffused faster
Does the rate of diffusion correspond with the molecular weight of the dye?
Yes, it did
Does the rate of diffusion change over time? Why or why not?
Yes as the solution will then reach equilibrium, the diffusion rate will decrease
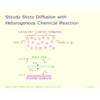
Examine the graph below. Does it match the data you recorded in Table 2? Explain why or why not. Submit your own plot if necessary.
No It did not match and the reason it didn’t is because the time and distance of the diffusion was wrong.
Experiment 2: Concentration Gradients and Membrane Permeability
Result Tables
Table 3: Indicator Reagent Data
Indicator
Starch Positive Control (Color)
Starch Negative Control (Color)
Glucose Positive Control (Color)
Glucose Negative Control (Color)
IKI Solution
Yellow
Orange
n/a
n/a
Glucose Test Strip
n/a
n/a
No color change(yellow)
No color change (yellow)
Table 4: Diffusion of Starch and Glucose Over Time
Indicator
Dialysis Bag After 1 Hour
Beaker Water After 1 Hour
IKI Solution
Orange/brown
Orange/brown
Glucose Test Strip
green
green
Post-Lab Questions
Why is it necessary to have positive and negative controls in this experiment?
-we use the positive and negative controls to know that there is no trace of glucose.
Draw a diagram of the experimental set-up. Use arrows to depict the movement of each substance in the dialysis bag and the beaker.
Which substance(s) crossed the dialysis membrane? Support your response with data-based evidence.
The glucose was the one that crossed the dialysis membrane because the glucose showed there was glucose present.
Which molecules remained inside of the dialysis bag?
Starch
Did all of the molecules diffuse out of the bag into the beaker? Why or why not?
No because when tested for starch the test was negative
|
|
Comments (0)
|
Post your homework questions and get free online help from our incredible volunteers
|