|
|
A free membership is required to access uploaded content. Login or Register.
Assignment 4
|
|
Uploaded: 6 years ago
Contributor: Guest
Category: Statistics and Probability
Type: Assignment
Rating:
(1)
|
Filename: ASSG 4 upload.docx
(56.51 kB)
Page Count: 5
Credit Cost: 1
Views: 112
Last Download: N/A
|
Transcript
Assignment 4
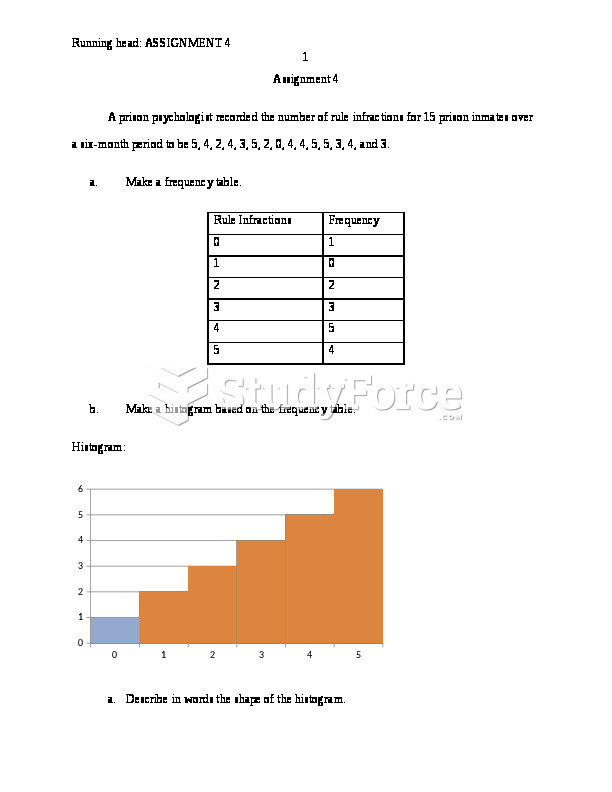
A prison psychologist recorded the number of rule infractions for 15 prison inmates over a six-month period to be 5, 4, 2, 4, 3, 5, 2, 0, 4, 4, 5, 5, 3, 4, and 3.
Make a frequency table.
Rule Infractions
Frequency
0
1
1
0
2
2
3
3
4
5
5
4
Make a histogram based on the frequency table.
Histogram:
Describe in words the shape of the histogram.
The histogram is skewed to the left with the mode being 4 and the mean being 3.571
2. Identify and solve this problem by hand.
The head of public safety notices that the average driving speed at a particular intersection averages ? = 35 mph with a standard deviation of ? = 7.5 mph. After a school speed limit sign of 20 mph is placed at the intersection, the first 40 cars travel past at an average speed of 32 mph. Using the .01 significance level, was there a significant change in driving speed?
a. Use the five steps of hypothesis testing (report results in APA format).
The research question would be based upon the average driving speed before and after a speed limit sign is put into place. The null hypothesis is ? = 35
The second step in the testing process leaves the alternative hypothesis as ? not equal to 35
The test statistic is sqrt(n)*(xbar- ?)/? a - and under the null hypothesis this follows a standard normal distribution.
The third step takes us to the reject ? = 35 if the absolute value of the test statistic is greater than 2.57583 – which is the point on a standard normal distribution above which 0.5% of the distribution lies.
Next are the calculations, using n = 40 and ? = 7.5 with the mean = 32
The absolute value of the test statistic = 2.529822
The means the conclusion is: the null hypothesis is accepted at 1% level of significance.
Sketch the distributions involved.
3. A social psychologist gave a questionnaire about concern for farm workers to seven participants before and after they attended a film about union organization of farm workers. The results are shown below with high scores meaning high concern. Using the .05 significance level, do these results support the hypothesis that the film affected concern for the lives of farm workers?
Scores on the Concern Measure
Participant Before After
A 17 20
B 7 4
C 10 11
D 13 15
E 8 5
F 9 8
G 11 14
The research question would be based upon the farmer’s concern before and after seeing a film about union organization. The null hypothesis is that the farmer’s concern before will not be higher than the farmer’s after seeing the film.
The second step in the testing process is regarding calculations:
The mean before =10.714 and the mean after = 11 with a standard deviation before =3.4017 and a standard deviation after = 5.774 and a Z = 0.0825 and the two sided tabulated Z = 1.96
Since 1.96 > 0.0825 we then accept the null hypothesis and conclude that the film does not affect concern for the life of farm workers.
Based upon the hypothesis testing results, we can conclude that the film had no effect on the concerns for the lives of the farm workers. This means that there was no significant difference between the two. The mean before was 10.71 while the mean afterwards was 11. This means that the effect size was not significant.
4. A team of cognitive psychologists studying the effects of sleep deprivation on short-term memory decay had eight participants stay in a sleep lab for two days. Four participants were randomly assigned to a condition in which they were not permitted to sleep during that period, while the other four participants were allowed to sleep when they wanted to. At the end of the two days, the participants completed a short-term memory task that yielded the results in the table that follows. Using the .05 significance level, did sleep deprivation reduce short-term memory?
Mean Number of Letters Remembered
Sleep Deprived Normal Sleep
7 9
8 8
7 11
9 7
Create the appropriate graph for this problem.
Use the five steps of hypothesis testing.
Figure the effect size.
Report results in APA format.
The research question would be that the sleep deprivation did not reduce short term memory, and the null hypothesis is that the sleep deprivation reduces short term memory.
The sleep deprived mean = 7.75 and the normal sleep mean = 8.75 with a standard deviation for sleep deprived = 0.9574 and a standard deviation for normal sleep = 1.7078
The Z-score = 0.7504 and the tabulated Z = 1.96
Since 1.96 > 0.754 we then accept the null hypothesis and are able to conclude that sleep deprivation did not reduce short term memory.
Based upon the hypothesis testing results, we can conclude that there was no effect of sleep deprivation on short-term memory. There was no significant difference on the effects of the two, both of normal sleep and of the ones who were deprived of sleep. The mean number of letters remembered for those who were deprived of sleep was 7.75 - whereas the mean for those with normal sleep was 8.75.
|
|
Comments (0)
|
Post your homework questions and get free online help from our incredible volunteers
1245 People Browsing
130 Signed Up Today
|