Transcript
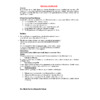
Table of Contents Introduction.......................................................................................................................2 Theory................................................................................................................................2 Experimental Procedure.....................................................................................................4 Results and Discussion.......................................................................................................5 Error Analysis....................................................................................................................8 Conclusions and Recommendations..................................................................................9 References..........................................................................................................................9 Appendices......................................................................................................................10 List of Figures Figure 1. A Schematic Flow Diagram of Filter Press and Pump System.........................4 Figure 2. Graph to Evaluate Kv and C..............................................................................7 List of Tables Table 1. Important Values..................................................................................................6 Introduction The purpose of this experiment was to determine the resistance of a filter medium and filter cake resistance of a plate-and-frame filter press for scale up of a filter press unit for dewatering sludge in a wastewater treatment plant. A 2% by weight calcium carbonate sludge was passed through pilot plant scale press-and-frame filter at a constant flow rate. The pressure drop, volume of filtrate collected and time were measured and used to calculate relevant constants. For the given 2% by weight calcium carbonate slurry, it was found that at a flow rate of 0.092 ± 0.008 L/s the resistance of a filter medium is 726157.9 m-1 and the resistance of the filter cake was 28651.66 m-2, the specific cake resistance was 429.81m/kg and the moisture content of the filter cake was 35.59%. The major sources of error were the fluctuation in the volumetric flow rate and error in volumetric measurements. It was concluded that this data can be used to scale up a filter press unit for the same slurry as was used in the experiment. Theory Plate-and-frame filter is commonly used in wastewater treatment. It can be operated in constant pressure or constant rate. In the condition of constant pressure, the flow rate of liquid has to decrease with the accumulation of the filter cake, which is not an ideal way to control production rate, so constant rate is used in industry more often than constant pressure. By doing experiment with small amount of sample, the data collected could be used to scale up the size of equipment. Calcium carbonate slurry is used in this experiment. With a positive displacement pump feeding slurry into the filters, cakes builds up on each of the filter cloth. The relationship between pressure drop and resistant of the filter cake can be expressed as: 1A*dVdt=-?P?*RCAV+RM (1)1 Where A is the filter area [m2], ?P is the pressure drop [Pa] Rc is the filter cake resistance [m-2] RM is the filter medium resistance [m-1] µ is the viscosity of the fluid [Pa*s] V is the total volume collected in the process [m3]. It can be seen that the pressure drop increases with the increasing volume V. To simplify the equation to: -?P=µRcdVA2dtV+µRMdVA dt (2) For ideal experiment condition, the following is assumed: the cake is incompressible in the process, and the cake is evenly spread in the filter cloth. So µ, A, and flow rate are constant in the formula. In equation 2, under constant volumetric flow rate, the relationship between total volume and pressure drop can be seen as linear. By collecting data of volume and pressure drop, the resistance Rc and RM can be calculated. Experimental Procedure: Tank Water Source Slurry Line Slurry Line Recycle Line Flow Meter Pressure Gauge Plate and Frame Filter Press Graduated Cylinder Drain Hydraulic Pump Pressure Gauge Figure1. A Schematic Flow Diagram of Filter Press and Pump System Approximately 2% (by wt.) calcium carbonate slurry was prepared and mixed in a continuously stirred tank. The calcium carbonate slurry was fed through the filter press by a pump. A hydraulic pump is set to approximately 8,000 psi, to force the filter plates together and prevent the slurry from leaking through the spaces between the filter plates. Since there will be cake build-up as the filtering progresses, the filtration rate varies. To maintain a constant flow rate, the recycle valve was adjusted accordingly. As the filtration process was carried out, the effluent/filtrate was collected in a calibrated graduated cylinder and time and pressure were recorded each time the cylinder had been filled up. The process was continued until a maximum pressure drop was observed. A representative sample of the filter cake was obtained from the plates. This was done by getting a sample from each plate to get the correct representative across the filter press. The sample was dried in the oven to evaporate the moisture of the filter cake. Moisture content was calculated by finding the difference in the weight of the cake before and after drying. The filter press system was then cleaned by backwashing with water. Results and Discussion: The purpose of this experiment was to determine filtration constants, Kv and C, so that they may be used for scale-up. From Figure 2, C is found to be 0.0184Pa and Kv is 0.0002Pa. The R squared value of 0.9511 from Figure 2 indicates the line is quite linear, so the Kv value could be a good approximation. If a few more trials are done or even done at different pump speeds, we could verify if Kv is a good approximation. However, this was not done because only one pump speed was working and the others were broken. The C value as well could be better approximated if we did more trials. The current value that was not obtained by the initial pressure drop as it should have been, but instead it was obtained by extrapolating the line back from 20L. The initial problem was that the flow rate was not stable because it fluctuated. We took a few minutes, at that time 20 liters of filtrate has been filtered, to stabilize the flow rate which is about 0.09 L/s. The limited amount of time is what restricted us from cleaning the equipment again and redoing the experiment to obtain better values. Another factor that could increase the accuracy of the experiment is the flow rate was regulated manually. From calculations the deviation of the calculated flow rate is 0.00823L/s. The flow rate can be better regulated if a process control that controlled the flow according to the pressure was in place. Using the constants Kv and C, Rc and Rm can be calculated. Since the slurry is greater than 99% water, the viscosity is assumed to be 1cp (that of water), Rc is 28651.66 m^-2 and Rm 726157.9 m^-1. These values can be used for scale-up if the same filter and solution is used because they are constant. Using these values and other constants, one may determine pressure loss and flow rate needed for the process, and buy the proper pumps needed for the process. Another useful value that was calculated was ?(specific cake resistance) which is 429.81 m/kg. Using this value, the pressure loss and flow rate can be calculated with changing calcium carbonate concentrations. The calcium carbonate concentration used in this experiment was 66.66kg/m^3. Table 1. Important Values Measured dV/dt from meter = 0.088 L/s Avg. dV/dt = 0.09198 L/s (Measured from Volume over time) Standard Deviation of dV/dt = 0.00823 L/s Kv = 0.0002 Pa Rc = 28651.66 m-2 Cs = 66.66kg/m^3 ? = 429.81m/kg C = 0.0184Pa Rm = 726157.9 m-1 Moisture content of filter cake = 0.3559 Figure 2. Graph to Evaluate Kv and C: a plot of pressure drop versus volume of filtrate collected Different constant flow rates should changed the pressure drop proportionally since all other variables in the formula would be constant for the same filter and filtrate. There might be a small variation in proportionality and one reason would be from the change in filter cake resistance. It is assumed that the filter cake is incompressible so it would stay constant, but in reality the filter cake will compress at higher flow rates. It could have been seen if the filter cake was compressible by measuring the density of the filter cake. This was not done because only one pump speed was used, so no densities could be compared. The moisture cake for the filter cake in this experiment was 0.3559. Error Analysis: The standard deviation of the average flow rate of slurry of 0.09199 L/s was 0.00823 L/s. The piping system of the filter press appeared to be not properly cleaned. This was evident when the tank was drained water coming out of the pipe still looked like slurry. If the pipes were not thoroughly cleaned and has been standing there for quite a while, the possibility of solid calcium carbonate depositing along the walls of the pipe lines may cause pressure reading errors during the experiment. The fouling of calcium carbonate on the walls of the pipes may have caused additional pressure drop across the filter and thus caused error in our constants. The hydraulic pressure which was supposed to be maintained at 8000 psi fluctuated and may have caused errors in terms of slurry passing between the filter plates if the pressure is not high enough. A very small amount of slurry leaked through the filter plates. Another possible source of error was in the collection of effluent. Although it was tried to be done as accurately as possible, having to transfer liquid from one container to another in a matter of seconds created losses that if accumulated will contribute to the inaccuracy of results in the volume of the effluent per time. Also the scale division on one of the graduated cylinders was very coarse which has affected the accuracy of our volumetric readings. Conclusion and Recommendations For a 2% by weight calcium carbonate slurry, it was found that at a flow rate of 0.092 ± 0.008 L/s the resistance of a filter medium is 726157.9 m-1 and the resistance of the filter cake was 28651.66 m-2. Our results can be used to scale up the (increase the area filtration) plate-and-press filter for a larger operation as long as the slurry composition remains the same. The specific cake resistance was 429.81m/kg and the moisture content of the filter cake was 35.59%. The specific cake resistance can be used to scale up the operation of an exactly the same filter press as was used in the lab for different mass fraction of calcium carbonate. Sources of error included pressure drop due to fouling, leakage of slurry, fluctuation of volumetric flowrate. We recommend fixing the other two pumps so that the effect of volumetric flow rate on the filter constant could be studied in case it is needed scale up the flow rate. We also recommend decreasing the scale on one of the graduated cylinders for more accurate volumetric measurements. References Mehrvar, M., “CHE 315: Unit Operation Laboratory 1 Laboratory Manual”, 2008, Ryerson University. Appendices Sample Calculations: Kv and C are read from the equation of a line on Figure 2. Kv is the slope of 0.0002 Pa and C is the intercept of 0.0184 Pa Rm = C * A / (? * dV/dt) 1= 0.0184 Pa * (10 filters * 0.363 m^2) / (1E-3 Pa*s * 0.09198E-3 m^3/s) = 726157.9 m^-1 Rc = Kv * A^2 / (? * dV/dt)1 = 0.0002 * (10 filters * 0.363 m^2)^2 / (1E-3 Pa*s * 0.09198E-3) = 28651.66 m^2 Cs = 0.001 kg solid / ((80-65)/1e6) m^3 = 66.66 kg / m^3 ? = Rc / Cs 1= 28651.66 m^-2 / 66.66 kg/m^3 = 429.81 m/kg Xtot = (130-109)g H2O/ (109-50) g solid = 0.3559 Average dV/dt = (10 + 5 + 30)L/s / 3 = 15L/s