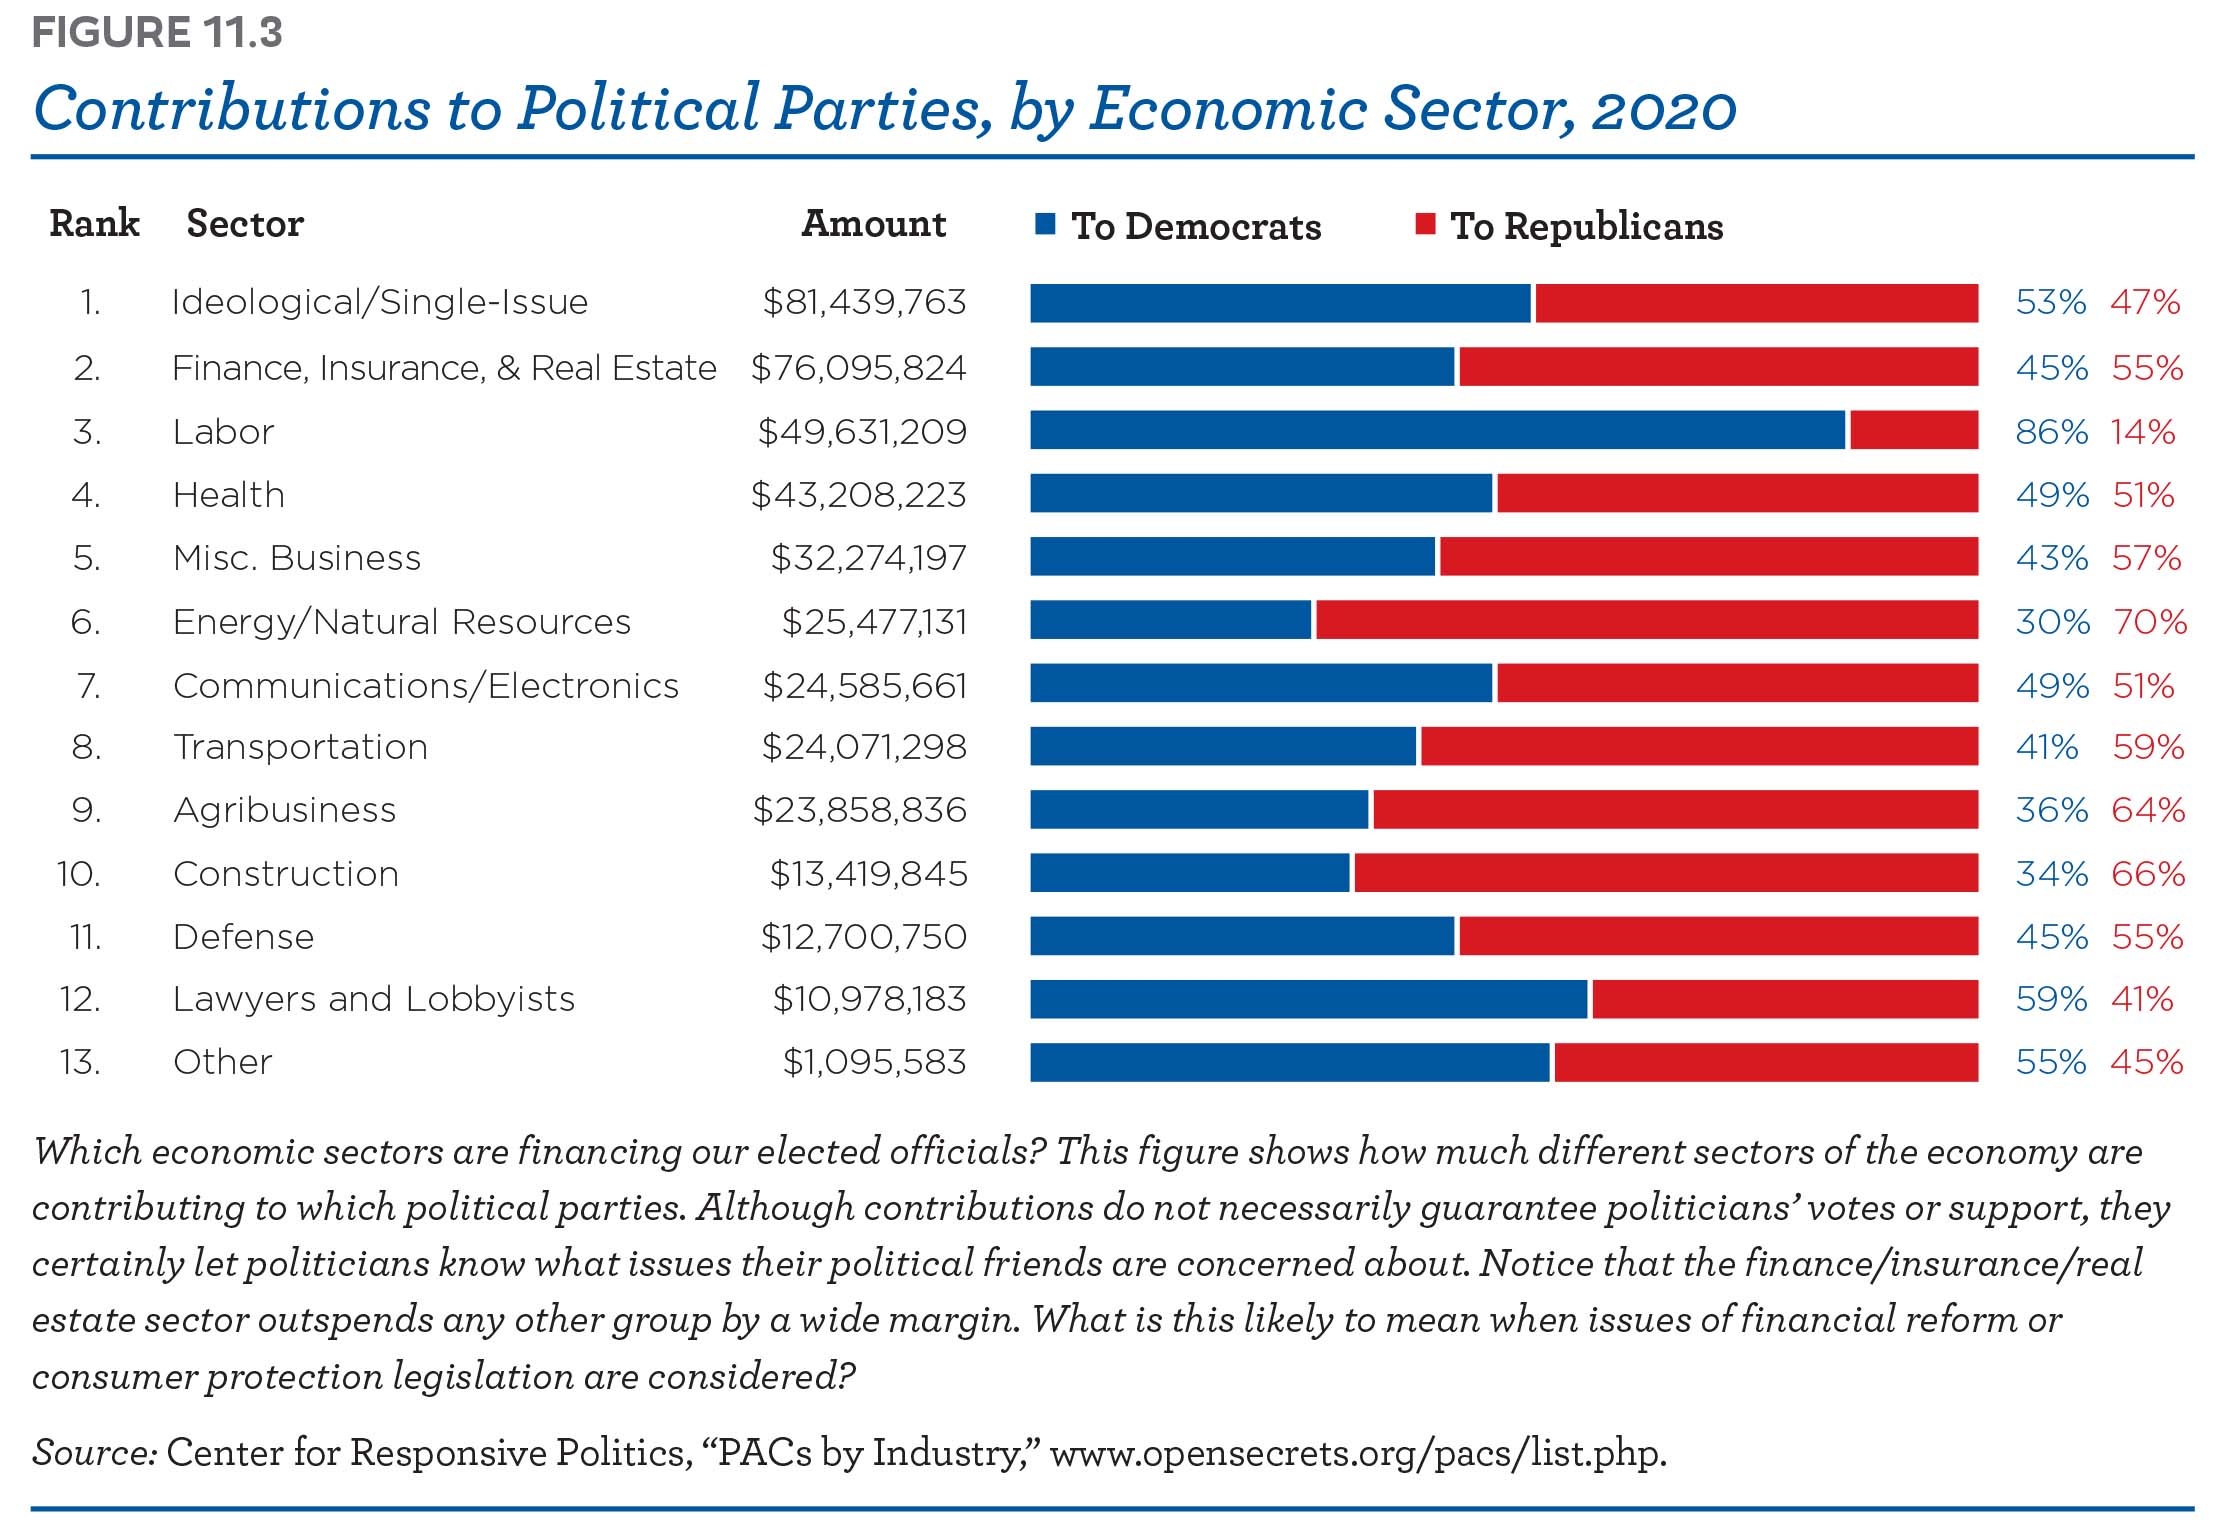
FIGURE 11.3 Contributions to Political Parties, by Economic Sector, 2020 Rank Sector Amount 1. deologicaI/SingIe—Issue $81,439,763 2. :inance, Insurance, & Real Estate $76,095,824 3. _abor $49,631,209 4. -iea|tn $43,208,223 5. isc. Business $32,274,197 6. Energy/Natural Resources $25,477,131 7. Communications/Electronics $2—-,585,661 8. Transportation $2—-,071,298 9. Agribusiness $23,858,836 10. Construction $13,419,845 11. Defense $12,700,750 12. Lawyers and Lobbyists $10,978,183 13. Other $1,095,583 I To Democrats I To Republicans 53% -5% 86% 9% -3% 30% 9% -1% 36% 34% 45% 59% 55% 47% 55% 14% 51% 57% 70% 51% 59% 64% 66% 55% —-1% —-5% Which economic sectors are financing our elected officials? This figure shows how much different sectors of the economy are contributing to which politicalparties. Although contributions do not necessarily guarantee politicians’votes or support, they certainly letpoliticians know what issues theirpolitical friends are concerned about. Notice that the finance/insurance/real estate sector outspends any other group by a wide margin. What is this likely to mean when issues offinancial reform or consumerprotection legislation are considered? Source: Center for Responsive Politics, “PACs by Industry,”
www.0pensecrets.org/pacs/1ist.php.