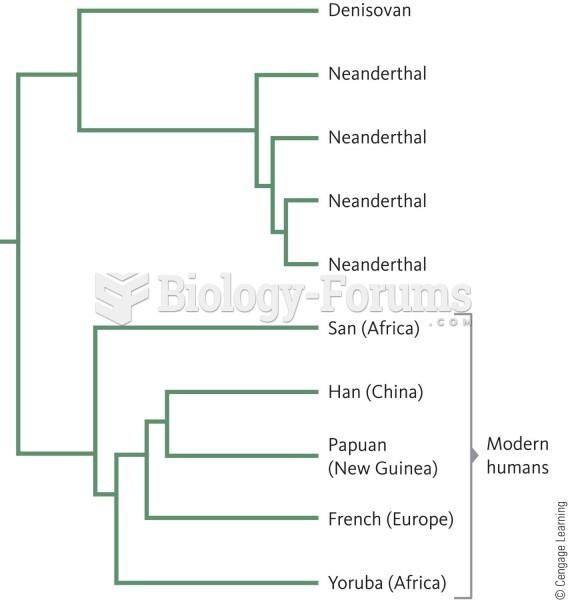
This phylogenetic tree is based on 1327 polymorphic markers, 848 repetitive sequence variants, 476 indels, and 3 SNPsThis phylogenetic tree is based on 1327 polymorphic markers, 848 repetitive sequence variants, 476 indels, and 3 SNPs
Genetic diversity among European. Asian. and Australian populations is a subset of that found in Africa, consistent with these populations being derived ” V“ 2° from an ancestral African in... mm “ " population. a . }Europe w” '— East Asia Nu- m *1... . ~55.“ m M" "”2““. ur- Americas “W- ...... “"‘j Maul “m M) m w- “..‘F-‘ww ”mm mummm been mm max. M M M... W Genetic distances are m” A“ positively correlated with a? geography and language. an,” M both globalty and Within 2:2, Afn‘ca. "5‘3... “all “M” “£1.“ Eastern Africa Ma m ":2 J: “A m M W We W m M mm “mm “3"" Que- > ‘ Nu. m ‘ '12:. M m»... a“... W %— Mum ”In...” m I... Such-bu) . 3" ”$53,, Western I Central Africa ‘ h" m M M W Mn“. m m m m African populations exhibit an.” the most genetic variatim. m' consistent with Africa being ”.3“ the source of all modern m I... humans. m mm “in m Du!- “ m women!!!) m “a W- ...... , :I- m Southem Africa/Pygmies m ‘- I...
Related Images
876
156
134
1027
176
614
245
3346
34
Add Comment
0 Comment
Explore
Post your homework questions and get free online help from our incredible volunteers