Transcript
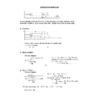
Experiment 27 Kinetics by Colorimetry Jonathan Brate April 15, 2009 Wednesday TA: Yusif Introduction: The objective of this experiment was to find and record the temperature and reactant concentrations on the reaction rate.This was accomplished by putting half of the solutions in water that was room temperature and the other half in a warm bath.During the experiment, crystal violet and sodium hydroxide were mixed together and absorbance and light wavelengths were measured.Doing this experiment requires that one understands how rate is expressed in change in concentration with time and being able to analyze between the average rate over a finite time interval and an instantaneous rate.The use of rate laws, integrated rate laws, Colorimetry, and the Arrhenius equation, is how experiment 27 relates to information in the lecture class.One laboratory technique in this experiment was being able to use a colorimeter.A colorimeter measures the absorbance of particular wavelengths of light.Another lab technique used was recording wavelengths of light simultaneously by using the MeasureNet system.Procedure: The procedure that was followed was the one given in the lab manual: Sprague, Alexander, Padolik and Steffel, Laboratory Experiments for First year Chemistry, 7th ed. pp. 27-5 to 27-9.Data and Results: A final summary of the data can be found on the attached graphs labeled Trial #1 – Trial #6 along with sample calculations.Along with the attached sheets are six three in one graphs containing zero order, first order and second order plots and represents how many trials were performed.Discussion:1.Use the graphs given to determine the value for the pseudo rate constant kobs for each trial. Kobs= - slope. This rule allows the students to determine the kobs.2.To determine order of reaction with respect to each reactant, choose with the most linear graph.In this case, the first order graphs are most linear.3.It does not affect the value of kobs because the concentration of crystal violet is so small, it has an insignificant influence upon the kobs.4.You would have to place a solution of crystal violet with known concentration in the colorimeter and note the absorbance value displayed.5.Yes, the room temperature graphs are is more linear to a slope of 1 as compared to the warm water bath which is not as close.Error Discussion: Difficulties that could have been encountered during the experiment includes using a contaminated beaker or pipet because having contaminated glassware can affect the results of the experiment, using a pipet to measure to the nearest 0.1 mL because not using the pipet accurately can change the whole experiment and its outcome, and waiting too long to insert the liquid into the colorimeter because if the reaction occurs before this then the graphs will show very little change.Conclusion: All of the objectives were met for this experiment.Mixing crystal violet and sodium hydroxide together and putting these solutions into the colorimeter, helped measure the absorbance.Mixing the solutions proved to be effective when weighing the outcome of the results.With the results found, one is able to use the integrated rate laws, Colorimetry, and Arrhenius equation to help solve the problems.