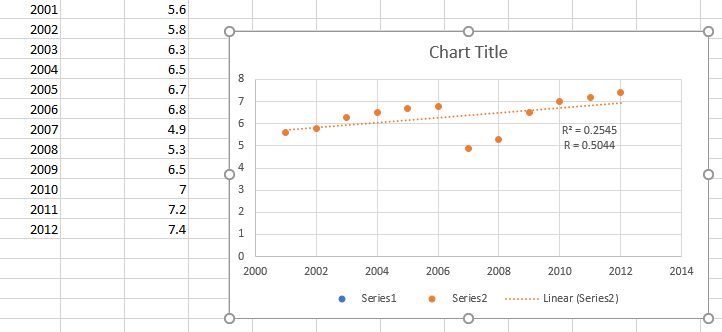
a)]Make a scatter plot out of this time series. Is swimming becoming more popular?
From what I see, the popularity is growing moderately.
b)Perform a linear regression.
Describe the strength of correlation.
From the linear regression, it appears to be moderate, positive. In fact, 0.50 indicate a moderate positive.
c)What graphical evidence is there of a
hidden variable?
The data experiences a dip after 2006, then shortly after audience begins to rise.
d)due to the downturn in the economy in 2007,
a large factory was forced to close down. What impact do you believe this had on the correlational study? (Find the variable that is hidden.)
An economical downturn means less people working. With less money in people's pockets, the first thing people cross off their list of pleasurably things to do is entertainment. This is likely the reason the attendance dropped.
e)What do you believe happened in the years after the factory/plant was shut down?
People found other work.
f)Remove the data points from 2007 to 2009 and run the linear regression again.
Take a look at the previous linear model and compare it to this one.
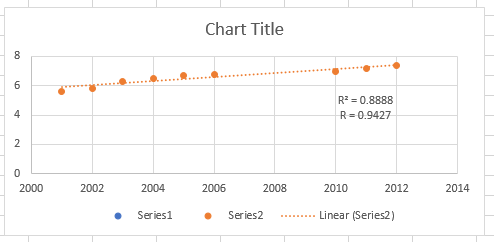
Now the correlation is strong, positive.
 Quick Reply