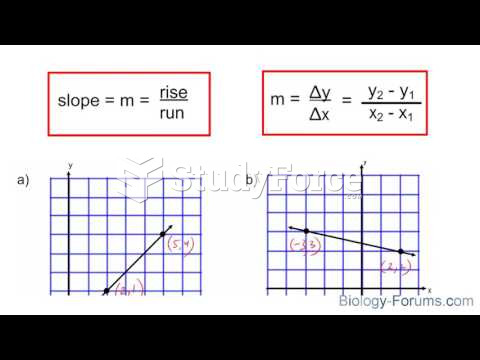
The estimated regression line is the line that minimizes the sum of the squares of the distances from the given
points to the line.
Indicate whether the statement is true or false
Q. 2The treatment sum of squares measures the variation within samples.
Indicate whether the statement is true or false
Q. 3Define statistics.
What will be an ideal response?
Q. 4The owner of a car dealership planned to develop strategies to increase sales. He hoped to learn the reasons why many people who visit his car lot do not eventually buy a car from him.
For one month he asked his sales staff to keep a list of the names and addresses of everyone who came in to test drive a car. At the end of the month he sent surveys to the people who did not buy the car, asking them why. About one third of them returned the survey, with 44 of those indicating that they found a lower price elsewhere. Which is true?
I. The population of interest is all potential car buyers.
II. This survey design suffered from non-response bias.
III. Because it comes from a sample 44 is a parameter, not a statistic.
A) I only
B) I and II only
C) II only
D) II and III only
E) I, II, and III
Q. 5For two events A and B, P(
A) = 0.3 P(B) = 0.6, and P(A B) = 0.4. Find P(A B).
A) 0.5 B) 1.3 C) 0.9 D) 0.4
Q. 6A survey of 1010 college seniors working towards an undergraduate degree was conducted.
Each student was asked, Are you planning or not planning to pursue a graduate degree? Of the 1010 surveyed, 658 stated that they were planning to pursue a graduate degree. Construct and interpret a 98 confidence interval for the proportion of college seniors who are planning to pursue a graduate degree.
A) (0.620, 0.682); we are 98 confident that the proportion of college seniors who are planning to pursue a graduate degree is between 0.620 and 0.682.
B) (0.612, 0.690); we are 98 confident that the proportion of college seniors who are planning to pursue a graduate degree is between 0.612 and 0.690.
C) (0.621, 0.680); we are 98 confident that the proportion of college seniors who are planning to pursue a graduate degree is between 0.621 and 0.680.
D) (0.616, 0.686); we are 98 confident that the proportion of college seniors who are planning to pursue a graduate degree is between 0.616 and 0.686.
Q. 7When considering area under the standard normal curve, decide whether the area between z = -1.5 and z = -1
is bigger than, smaller than, or equal to the area between z = 2 and z = 2.5.
A) bigger than B) smaller than C) equal to
Q. 8The mean of a probability distribution is always a value that can be obtained by the random variable.
Indicate whether the statement is true or false
 Quick Reply