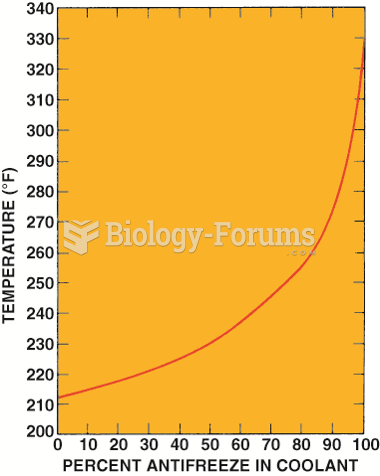
The following graph resulted when a researcher plotted the paired scores from two sets of data: Which of the following conclusions is justified from an examination of the graph?
a. The coefficient of correlation is close to .50.
b. The correlation between X and Y is negative and low.
c. The correlation between X and Y is positive and high.
d. A Spearman rho coefficient of correlation is appropriate for these data.
e. A Pearson's coefficient of correlation is not appropriate for these data.
Ques. 2If a relationship between two variables is spurious, we conclude that it is
a. nearly always a cause and effect relationship.
b. partially regressed.
c. accounted for by another extraneous variable
d. not a statistically significant relationship.
e.
Ques. 3Research has shown that high school students' scores on the SAT correlate .40 with college freshman grades. Assuming that only half of the students who took the SAT were admitted to a given college, what would you estimate the correlation to be between their SAT scores and freshman grades?
a. Negative and lower than .40 c. Positive and higher than .40
b. Negative and higher than .40 d. Positive and lower than .40
 Quick Reply