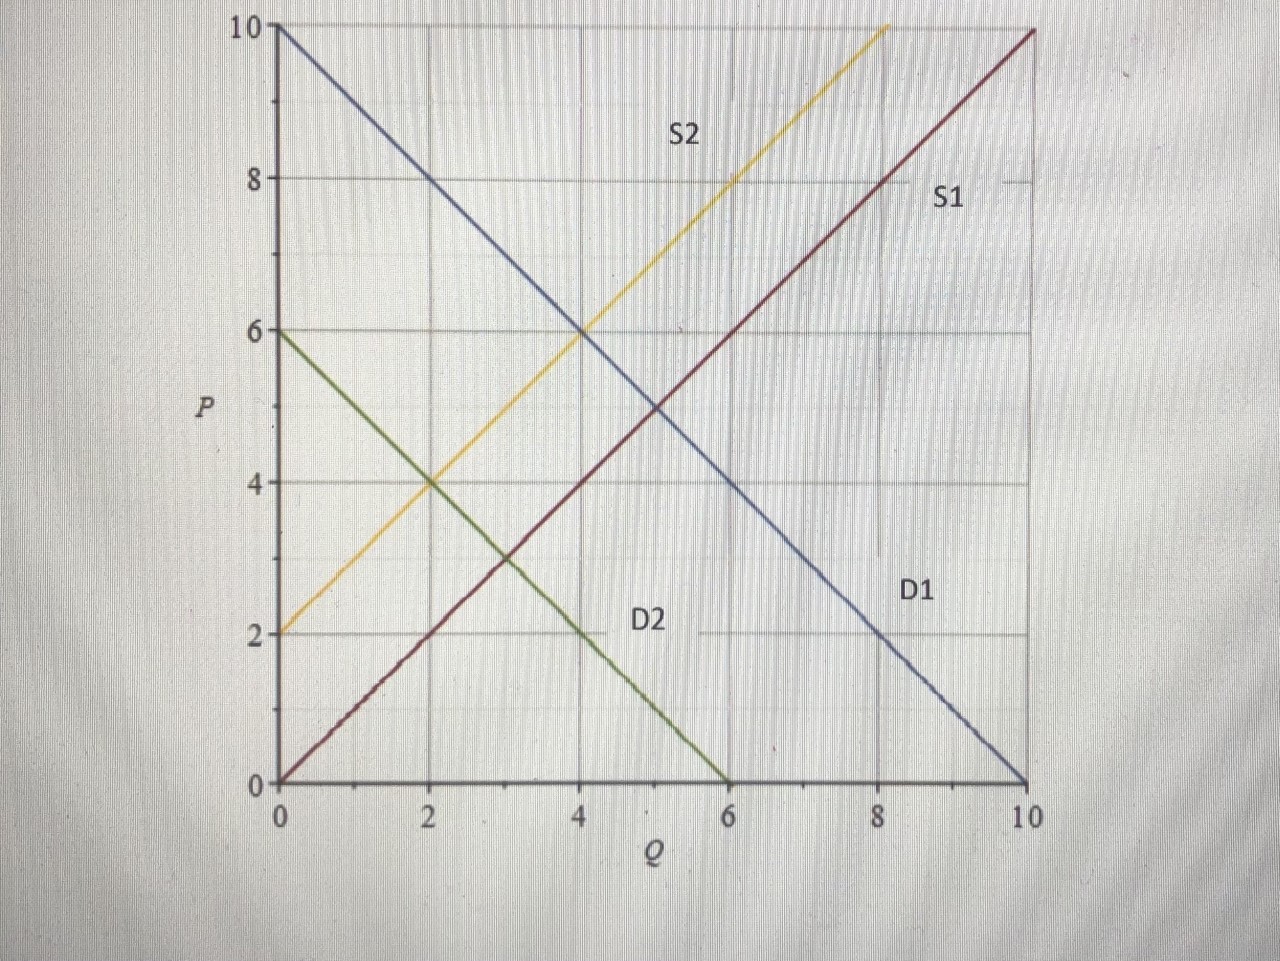
The graph below illustrates the market for diesel cars. The horizontal axis shows the number of cars sold (normalized quantity) Q. The vertical axis shows the (average) price P for a diesel car.
Demand is described by the blue curve D1 while supply is described by the red S1.
(a) What is the equilibrium price of diesel cars?
(b) What is the equilibrium quantity?
A law will be introduced that bans diesel cars after the year 2024. This will have an immediate effect on demand as
switches to the green D2.
(c) At the original price, the price you stated in question (a), what will be the supply surplus?
(d) What is the price in the new equilibrium (S1 and D2)?
Electric cars are becoming cheaper to manufacture thanks to the falling price of batteries. Many car manufacturers choose
therefore shifting production away from diesel cars in favor of electric cars and the supply falls to yellow S2.
(e) What is the new equilibrium price (S2 and D2)?
(f) What is the new equilibrium quantity?
(g) What is the total revenue in the new equilibrium?
You do not have to justify your answers, but only state the seven numbers in questions (a) - (g)
 Quick Reply