I'm guessing the times are just wrong maybe? Thank you for taking a look, btw.
Hi,
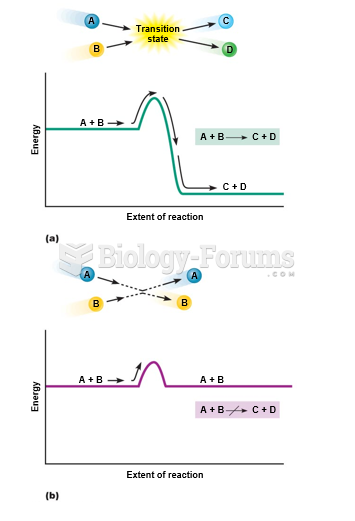
I actually re-do your work a few times, but still come up with the same answers, so I don't think it's calculation errors. You're right that the Ea should be much smaller for the catalyzed reaction. One of the explanations off the top of my mind that can account for this mismatch of observation and calculation is human error. Regarding the calculated Ea for catalyzed reaction is higher than the uncatalyzed ones, the slope of the graph is based on the differences in y and x-axis: (y-y)/(x-x), so this means that what matters is the differences between the y axis and the x axis of each data set and not how big the number from one data set compared to other numbers from different data set. At this point, I would recommend you to ask your TA for what to do next, since each TA grades differently. In the attachment is one of the example about lab that I found online. I apologized that I couldn't be more helpful this time.

 Quick Reply