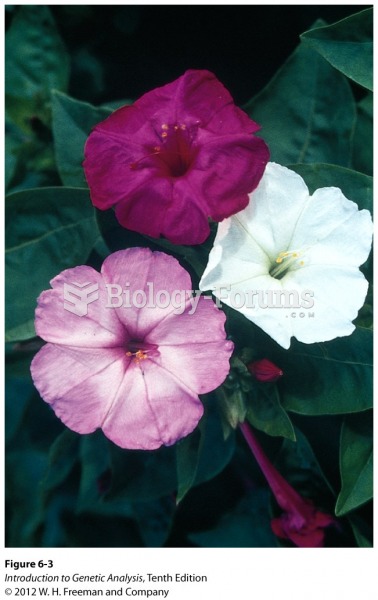
Dominant-recessive relationships can make determining genotype tricky, since an individual with the dominant phenotype may have either the homozygous dominant genotype or the heterozygous phenotype. In many cases, however, alleles may have incomplete dominance or co-dominance relationships, in which one allele does not completely mask the other. This makes it easier to determine genotypes based on phenotype. For example in four-o'clocks, a flowering plant, two alleles are common, one for red flowers and one for white flowers. Red flowering plants are homozygous for the red allele, and white flowering plants are homozygous for the white allele. Heterozygous plants will have red and white stripes. This is an example of co-dominance. Both distinct phenotypes are evident in the red and white stripes. In some other flowering plants, red and white are again, common alleles, but the heterozygous plants have pink flowers, and intermediate phenotype. In this case, red incompletely masks white.
The genotypic frequencies are again expected to follow a binomial distribution. If, for example, in four o'clocks the frequency of the red allele is 0.4 and the frequency of the white allele is 0.6, then the expected frequency of red-flowering plants is 0.42 = 0.16, the expected frequency of white flowering plants is 0.62 = 0.36, and the expected frequency of red and white stripped flowering plants is 2(0.4)(0.6) = 0.48.
1)Determine the allele frequencies for red and white. Determine the expected genotypic frequencies. Does the population conform to Hardy-Weinberg expectations?
2)Does this population of flowers conform to your expectations based on Hardy-Weinberg Principle?
3)How might you explain your observed phenotypic frequencies?
4)Please fill the table below:
Observed Phenotypic Frequencies RED WHITE RED AND WHITE STRIPPED
Allele Frequencies
Expected Phenotypic Frequencies
Please help guys I'm stuck

 Quick Reply
")

")


")


")