Transcript
Ryerson University
Department of Chemical Engineering
CHE 415 Unit Operations II
Lab Report
Experiment #9
Vapour Liquid Equilibrium
Experiment Performed on 2 November 2009
Report Submitted to
Dr.
By Group # 3 Section # 3 1. (Safety Inspector)
2. (Leader)
3. (Data Reporter)
Submitted on: 9 November 2009
Marking Scheme
Formatting Used all 6 writing points in each section of the report / 10
General Appearance; Grammar and Spelling / 5
Complete and Informative Tables and Graphs / 15
Contents Calculation of Accuracy and of Precision of Results / 20
Comparison with Literature Data (expected results) / 10
Discussion on Influence of Procedural Design on Results / 10
Logic of Argumentation / 20
Sample Calculations / 10
_____ Total: / 100
Table of Contents
Introduction 4
Theoretical Background 5
Schematic of the Experiment 7
Experimental Procedure 9
Results and Discussion 10
Error Analysis 13
Safety Concerns 14
Conclusions 15
Appendix 16
Sample Calculations 17
List of Figures
Figure 1VLE for Binary Mixture Water and Methanol 6
Figure 2. Othmer Equilibrium Still 8
Figure 3. Comaprison of Obtained Liquid Vapour Equilibriums 11
Figure 4. Thermal Consistency Curve for Methanol-Water Equilibrium Data 12
Introduction
The objective of this experiment was to determine if the experimental vapor-liquid equilibrium of a methanol and water solution acted as an ideal solution or a non-ideal solution. Using experimental results the ideal equilibrium values using Raoult’s Law are compared to the non-ideal values from Van Laar constants. A secondary objective is to determine the thermodynamic consistency of the results by finding the area under the curve of a graph of ln(1/2) versus mole fraction of methanol in the liquid.
This experiment involved the determination of the vapour-liquid compositions of three different methanol and water solutions using an Othmer Still to distil the binary mixture. This mixture was then allowed to reach equilibrium at which for each mixture the temperature was recorded. The vapour phase evaporated and condensed back to the main chamber. The various temperatures are used for the calculation of the vapour pressures of the methanol and water. Using a pycnometer the densities were found in the distillate receiver and boiling flask using.
The results were calculated using Raoult’s equation for ideal solutions to obtain the liquid and vapour compositions and the Van Laar’s activity coefficients were calculated and used in the modified Raoult’s equation for non-ideal solutions. The results obtained showed the system behaved ideally and was better approximated by Raoult’s Law.
Theoretical Background
Vapor-liquid equilibrium (VLE) occurs when the rate of evaporation of the liquid equals to the condensation of the vapor. The solution can be binary or multi component, for this experiment a binary solution of methanol and water is analyzed at varying (methanol v/water v) ratios; (25, 75), (50, 50), (75, 25). The vapor pressure of a liquid is dependent on temperature. The different mixtures of the solution is non-ideal, assuming ideality Raoult’s law is applied equation (1), see graph 1 for the VLE relationship between water and methanol at atmospheric pressure.
(1)
PA - vapor pressure of pure component A at the equilibrium temperature (atm)
P - the equilibrium pressure (atm)
yA- vapor mole fraction of component A
xA - liquid mole fraction of component A
Figure 1VLE for Binary Mixture Water and Methanol
PA, is determined with Antoine’s equation (2). This equation is a relationship between temperature and vapor pressure of liquids
(2)
A, B and C are the Antoine coefficients,
T is absolute temperature (K)
P is vapor pressure (atm)
The pressure can be used to calculate the mole fraction of the liquid, xA by using Raoult’s law in terms of pressure equation (3).
(3)
Pmethanol - partial pressure of the methanol (atm)
Pwater - partial pressure of the water (atm)
Ptotal - total pressure. (atm)
Van Laar equation correlates liquid-phase activity coefficients of binary mixtures , see equation (6).
ln ?1 = A/[1 + A x1/Bx2]2 & ln ?2 = B/[1 + Bx2/A x1]2 (6)
?1 and ?2 are the activity coefficients for species
A and B are the van Laar constants
x1 is the liquid mole fraction of methanol
x2 is the liquid mole fraction of water.
The experiment is thermodynamically consistent when it satisfies the Gibbs-Duhem equation (7)
x=1 T (x=1)
?x=0 ln(1/2) dx = -?T (x=0) [Hex/(RT2)] dT (7)
Hex is the experimental enthalpy
R is the gas constant
Schematic of the Experiment
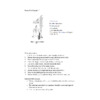
Vapour-liquid equilibrium will be analyzed using Othmer equilibrium still. The vapour is totally condensed and, therefore, the liquid in the chamber has the same composition as the vapour that was in equilibrium with the liquid in the boiler. Since more volatile component (methanol) will evaporate first, the composition of the boiling pot changes. To account for this, a siphon is installed in a chamber that returns liquid to the pot. For current experiment feed is methanol-water mixture, and the Othmer still has a structure outlined below in figure 1:
Figure 2. Othmer Equilibrium Still
Major components of the still are (refer to the figure):
Boiling pot.
Central and outlet vapour tube.
Thermocouple.
Condenser
Pot sampling port.
Interchangeable receiver with liquid sampling port.
Experimental Procedure
A beaker of water-methanol solution was prepared from the recovered methanol vessel. Pure methanol was added to the beaker to establish the following compositions: Beaker #1: 77% methanol (Pycnometer was used to determine the density of the solution, and the correlation chart was used to correlate density with methanol %). The boiler was half filled with the water-methanol solution from Beaker #1. Heat was applied to the boiler. Time for the boiling to beginning was recorded. The temperature is recorded. The chamber was allowed to fill and empty four times. At this time vapour and liquid are expected to be at equilibrium. The condensed solution was collected from the chamber. The sample was allowed to cool, the density of the liquid was determined using a pycnometer, and the final methanol concentration was obtained. Methanol concentration was also determined for the boiling pot. After information was recorded, the final boiling pot methanol concentration was used as solution 2, and the procedure was repeated twice. Heating was shut off and the apparatus is allowed to cool down (cool water was left running through the condenser).
Results and Discussion
The results found show that this system behaves ideally; the vapour mole fractions calculated experimentally are closer to the mole fractions calculated using Raoult’s Law than the Modified Raoult’s Law. This means the Van Laar activity coefficients are unnecessary, thus making the system ideal. A complete table of results, Table 1, as well as a plot to compare the theoretical and experimental vapour mole fractions of methanol is below:
Table 1. Methanol Mole Fractions Obtained in Liquid-Vapour Equilibrium Experiment
Experimental Vapour Fraction
Raoults Law Vapour Fraction
Modified Raoults Law Vapour Fraction
% Error
High Concentration
0.775
0.855
0.915
9.30%
Medium Concentration
0.679
0.794
0.902
14.48%
Low Concentration
0.567
0.633
0.697
10.42%
The discrepancy between the two forms of Raoult’s Law and the experimental values is due to the boiling point temperature recorded. It was estimated the boiling temperature should have been a couple degrees higher then recorded. Increasing the temperature by about 6oC would significantly lower Raoult’s Law calculated mole fractions to match the experimental results. The consistency in the % error further proves the above statement in regards to the mole fractions.
Figure 3. Comaprison of Obtained Liquid Vapour Equilibriums
A plot of ln(ym/yw) vs. xm was performed and the area under the curve was found using Simpson’s 1/3 Rule. The area calculated, -0.104, is minimal proving that the system was thermodynamically consistent.
Figure 4. Thermal Consistency Curve for Methanol-Water Equilibrium Data
Sampling the condensate beaker every time it’s filled and emptied might be a useful procedure, since it will illustrate, whether the system has reached equilibrium after the first fill-and-empty cycle, or whether more cycles are needed. However, removing a significant amount of condensate will change the amount of methanol and water present in otherwise closed system, would disturb the equilibrium, and thus any obtained data would be largely meaningless. Since the volume required for concentration analysis (volume of pycnometer) is 25 mL, which constitutes 8% of the total volume of the boiler, it was concluded that sampling during the equalization stage would disturb the process of reaching equilibrium.
Idealized models for distillation are governed by Raoult’s Law and Dalton’s Law. Raoult’s Law states that component contributes to the total vapor pressure of the mixture in proportion to its percentage of the mixture and its vapor pressure when pure. If one component changes another component's vapor pressure, or if the volatility of a component is dependent on its percentage in the mixture, the law will fail. Dalton's law states that the total vapor pressure is the sum of the vapor pressures of each individual component in the mixture. When a multi-component liquid is heated, the vapor pressure of each component will rise, thus causing the total vapor pressure to rise. When the total vapor pressure reaches the pressure surrounding the liquid, boiling occurs and liquid turns to gas throughout the bulk of the liquid. If the mixture behaves according to these two laws, it can said to be ideal and various parameters can be estimated using equations associated with these laws (see theory section).
Azeotrope occurs when a mixture is mixed in such a way that its components cannot be separated by distillation. It means that when vapour and liquid of the mixtures are at equilibrium, their concentrations in both phases are the same. Thus distillation of an azeotropic mixture is meaningless, so special techniques need to be employed in order to separate components.
Error Analysis
From the results it can be seen that the non- ideal had a higher percentage error than the ideal signifying that ideal was more closely related to the literature data. Sources for these errors could be that at the start of the experiment, the equipment was not completely cleaned and dryed form the previous experiment, there was some residual mixture left inside the apparatus from previous use. This would have affected the accuracy measured in the initial concentrations of the solution. Another error came from using the pycnometer when measuring the density of the distillate and the residue with a pycnometer. When transferring the distillate or residues from the beaker to a pycnometer a small portion was split. The temperatures used for the determination of properties such as density were based on 20 centigrade, but the actual temperature and pressure of the room were not confirmed.
Safety Concerns
A Bunsen burner was used as the heating source to boil the solution. Since an open flame was produced precautions had to be taken when working around it. Flammable material had to be kept away and monitored from the flame at all times. Loose clothing had to be checked and tucked in or removed. When making contact with heated equipment, it was important not to touch the heated equipment with bare hands. Insulated gloves were worn in order to avoid severe burns from the heated equipment.
The second safety concern deals with the use of Methanol in the laboratory. Methanol is a flammable liquid solvent which can cause blindness and even death if ingested or large amounts of fumes are inhaled. It has a faint odder, similar to common alcohol, and is it is also characterized as a toxic material. It can cause moderate skin irritation, moderate to severe eye irritation and vision problems and headaches with acute exposure. For these reasons, extreme caution was taken when handling this material. Gloves were worn when handling or decanting the methanol solutions and goggles were worn at all times. If Methanol does come into contact with either skin or eyes, the areas should be flushed immediately with water and medical attention should be sought immediately. Also, Methanol should be kept away from any open flames due to its flammability. If a methanol based fire does occur, it should be put out with either dry chemical or Carbon Dioxide. Water can cause the spread or dispersal of the fire.
Conclusions
This experiment was performed to obtain vapour-liquid equilibrium data of a binary mixture of methanol and water. The experimental data was used to compute the VLE curve based on an ideal and non-ideal assumption which was then compared to the expected literature results. The results showed an ideal relationship between the mole fractions of methanol in the vapour and liquid phases at equilibrium. It was also concluded that the experiment was thermodynamically inconsistent.
The equipment should be cleaned before use and properly after to reduce errors in concentration as stated previously this would remove any methanol-water solution that may have remained in the apparatus from a previous experiment. The number of trials performed can also be greater as to increase the number of data points that can be used to determine whether the system is ideal or non-ideal. A better flask should be used for the collection and also the products. A beaker proved clumsy and inaccurate.
.
References
Perry, R. H., & Green, D. W. (2008). Perry's Chemical Engineering Handbook. McGraw-Hill.
Seader, J. D., & Henley, E. J. (2001). Separation Process Principles. New Jersey: John Wiley & Sons.
Treybal, R. E. (1995). Mass Transfer Operations. McGraw HIll
.
Turcotte, G. (2009). Unit Operations II Lab Manual;. Toronto, Ontario, Canada.
Winnick, J. (1997). Chemical Engineering Thermodynamics. New Jersey: John Wiley and Sons .
Appendix
Table 2. Obtained and Calculated Values
High Conc. [77%]
Medium Conce. [57%]
Low Conc. [24%]
Initail Conc.
77%
57%
24%
Boiling Temp C
74
77
83.5
Distillate Density
0.83 g/ml
0.85 g/ml
0.87 g/ml
Ditillate Conc.
86%
79%
70%
Pot Density
0.90 g/ml
0.92 g/ml
0.97 g/ml
Pot Conc.
57%
47%
17%
Init. Mole fr. Water
0.3470
0.5730
0.8493
Init. Mole fr. Methanol
0.6530
0.4270
0.1507
Vapour mol fr. Water
0.2246
0.3211
0.4326
Vapour mol fr. Methanol
0.7754
0.6789
0.5674
Liquid mol fr. Water
0.5730
0.6673
0.8968
Liquid mol fr. Methanol
0.4270
0.3327
0.1032
Raults Law
methanol P*
1078.6323
1202.8905
1512.5667
water P*
277.2910
314.2455
408.6963
X methanol
0.6024
0.5016
0.3182
X water
0.3976
0.4984
0.6818
Y methanol
0.8549
0.7939
0.6334
Y water
0.1451
0.2061
0.3666
Modified Raults Law
activity coefficient meth
1.07
1.08
1.1
activity coefficient water
1.28
1.32
1.62
Y methanol
0.9148
0.8574
0.6967
Y water
0.0678
0.1125
0.3194
ln (ym/yw)
-0.179201429
-0.200670695
-0.387115969
X methanol
0.4270
0.3327
0.1032
Sample Calculations
Using a 50/50% volume solution of methanol in water
(Before boiling of the solution)
Moles of methanol = (175 ml)*(0.791 g/mL)/ 32 g/mol = 4.33 moles
Moles of water = (175 ml)*(0.995 g/mL) / 18 g/mol = 9.67 moles
Total Moles: 4.33 + 9.67 = 14 moles
Methanol: 4.33 / 14 = [0.31 mole fraction]
Water: 9.67 / 14 = [0.69 mole fraction]
Finding mole fractions of vapour condensate and pot liquid using first run data
(Mass of pycnometer + condensate - Mass of empty pycnometer) / volume of pycnometer
= (18.6 g - 10.3 g) / 10mL
= 0.83 g/mL
From pg. 3-88 (Densities of Aqueous Organics Solutions) in Perry’s Handbook for Methyl Alcohol at 20°C, 0.83 g/cm3 corresponds to 86 %wt solution of methanol. Setting a basis of a one gram solution, 0.86 grams will be the methanol and 0.14 grams water.
Then,
Moles of methanol = 0.86 g / 32g/mol = 0.0269 moles
Moles of water = 0.14 g / 18 g/mol = 0.0078 moles
Total moles = 0.0269 + 0.0078 = 0.0347
Methanol mole fraction in distillate: 0.0269/ 0.0347 = [0.7752 mole fraction]
Water mole fraction in distillate: 0.0078 / 0.0347= [0.2248 mole fraction]
List of Equation Symbols
?methanol = activity coefficient for methanol
?water = activity coefficient for water
xmethanol = liquid mole fraction of methanol
xwater = liquid mole fraction of water
y1 = vapour mole fraction of methanol in vapor
y2 = vapour mole fraction of water in vapor
A = Van Laar activity constants for water/methanol system
B = Van Laar activity constants for water/methanol system
A1, B1, and C1 are constants for Antoine’s Equation
fi = fugacity of component i in liquid
Po = Vapor pressure (Kpa)
P = Total Pressure(Kpa)
Finding vapor pressure to use in Raoult’s law
Using Antoine’s equation
log10P* = A – B /(T + C)
P*(mm Hg), T (C) with:
Range (C)
A
B
C
Methanol:
64 to 110
7.87863
1473.11
230
Water:
60 to 150
7.96681
1668.21
228.0
At a boiling point of 74C at 1 atmosphere:
Methanol: log10P* = 7.87863 - (1473.11/ (74 + 230))= 2.902
P* = 1078.824 mmHg
Water: log10P* = 7.96681 – 1668.21 / (66 + 228.0) = 2.293
P* = 277.17 mmHg
Finding mole fractions of the liquid phase:
Raoult’s law in terms of pressure:
xmethanol = (Ptotal – P*Water) / (P*Methanol – P*Water)
= (760mmHg – 196.17 mmHg) / (797.824 mmHg – 196.17 mmHg)
= 0.9371
xwater = 1.0 – 0.9371
= 0.063
Finding mole fractions of the vapor phase:
Raoult’s law in terms of pressure: yAP = xAPA*(T)
ymethanol = (0.9371)(797.824 mmHg)/(Ptotal)
= (747.641mmHg) / (760mmHg)
= 0.984
ywater = 1.0 – 0.984
= 0.016
Calculation of activity coefficient of methanol:
The Van Laar Equations are: (8)
Where y1 and y2 are the activity coefficients
In this experiment, 1 – Methanol and 2 – Water
A12 = 0.8041, A21 = 0.5619
Using xM and xW calculated with Antoine’s equation, yM and yW can be found.
T
herefore yM = 1.102. Similarly, yW = 1.270
The modified Raoult’s Law states:
Therefore, using the modified Raoult’s Law, YM = 0.9206
Thermodynamic Consistency:
The following is to be plotted: and the area under this curve is calculated using Simpson’s One Third Rule.
Where