|
|
A free membership is required to access uploaded content. Login or Register.
Chapter 4 IM
|
|
Uploaded: 7 years ago
Contributor: Guest
Category: Medicine
Type: Outline
Tags: activity, students, receptor, patient, therapeutic, classroom, clinical, different, patients, median, effect, discuss, response, identify, agonist
Rating:
N/A
|
Filename: 0133954757_im04.doc
(72.5 kB)
Page Count: 6
Credit Cost: 1
Views: 167
Last Download: N/A
|
Description
Pharmacology: Connections to Nursing Practice, 3rd Edition
Transcript
Chapter 4
Pharmacodynamics
Learning Outcomes:
1. Apply frequency distribution curves to explain interpatient variability in medication response.
Suggested Classroom Activity: Provide a graphic outline on the board or other media and involve students in identifying the average dose response versus the minimal response.
Suggested Clinical Activity: Using an example of a drug being taken by an actual patient, discuss how the response to this medication may differ if it is taken by another patient.
2. Explain the importance of the median effective dose (ED50) to clinical practice.
Suggested Classroom Activity: Divide students into groups and assign each one a different drug, such as ampicillin, Lanoxin, pantoprazole (Protonix), or acetaminophen. Have them research the average median dose for their drug and discuss how this dose was chosen. Discuss when and why the dose may need to be decreased or increased.
Suggested Clinical Activity: Have students look at the medication profile of their assigned patients and examine whether the patients are receiving an average dose of the medication; if they are not, discuss why.
3. Compare and contrast median lethal dose (LD50) and median toxicity dose (TD50).
Suggested Classroom Activity: Have students identify four commonly administered drugs with a low margin of safety and discuss nursing assessments required when administering these drugs.
Suggested Clinical Activity: Have students examine the drugs their assigned patient is receiving and determine if he or she is receiving a safe dose.
4. Relate a drug’s therapeutic index to its margin of safety.
Suggested Classroom Activity: Have students calculate the therapeutic index for drugs within the same classification, such as beta blockers or diuretics, and discuss how safe the drug will be.
Suggested Clinical Activity: Assist students to determine the therapeutic index of one or two drugs that an assigned patient is receiving.
5. Identify the significance of the dose?response relationship to clinical practice.
Suggested Classroom Activity: Have students break into groups and assign each a different analgesic drug, including both narcotic and nonnarcotic drugs. Have them discuss how increasing the dose or frequency of the drug will affect the therapeutic effect and adverse effects on a patient.
Suggested Clinical Activity: Have students identify a drug that has reached a plateau level in an assigned patient and discuss why they feel the plateau effect has been reached. Some suggestions for them to explore are blood pressure control with antihypertensives, pain control with analgesics, and control of gastric symptoms with proton pump inhibitors.
6. Compare and contrast the terms potency and efficacy.
Suggested Classroom Activity: Divide students into small groups and assign two drugs within the same class (such as a loop diuretic or ACE inhibitor). Have the students identify which is more potent and why. Discuss the concept of efficacy; is one drug more efficacious than the other?
Suggested Clinical Activity: Have students choose a patient who has two different classes of drugs ordered for pain, such as a narcotic and a nonnarcotic. Discuss why the narcotic is more potent, but may not necessarily be the more efficacious drug, depending on the origin of the pain.
7. Describe the relationship between receptors and drug action.
Suggested Classroom Activity: Assign different groups of students a specific drug, such as metoprolol, albuterol, or epinephrine. Have them discuss which receptor is being affected and whether it is stimulating or inhibiting the receptor site.
Suggested Clinical Activity: Have each student choose two different drugs an assigned patient is receiving. Have them identify which receptor is being affected and how.
8. Distinguish between an agonist, partial agonist, and antagonist.
Suggested Classroom Activity: Assign different groups of students a specific drug, such as metoprolol, albuterol, or epinephrine. Have each group identify whether the drug is an agonist, partial agonist, or antagonist and why.
Suggested Classroom Activity: Explore how drug–food interactions have agonist and antagonist properties, using warfarin (Coumadin) as an example.
Suggested Clinical Activity: Have each student choose two different drugs an assigned patient is receiving. Identify which action the drug has on the receptor site.
Suggested Clinical Activity: Have students identify any drug–drug or food–drug interactions that could act as agonists or antagonists.
9. Explain possible future developments in the field of pharmacogenetics.
Suggested Classroom Activity: Discuss the goals of the Human Genome Project and provide examples of how drugs can be used in the treatment of disorders that are detected genetically in a patient, such as Alzheimer’s disease.
Suggested Clinical Activity: Have each student explore the possibility of how drugs could be used to the advantage of a patient if any genetic markers were found on the patient.
Key Concepts
Pharmacodynamics is what the drug does to the body. Pharmaco means “medicines,” and dynamics means “change.”
Pharmacodynamics involves a drug’s mechanism of action and the effect of drug concentration on body responses.
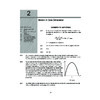
The frequency distribution curve provides a graphic representation of how a specific number of patients respond to different doses of the same drug.
The horizontal axis shows range of doses.
The peak of the curve indicates the largest number of patients responding to the drug.
The dose in the middle of the frequency distribution curve represents the drug’s median effective dose.
The median effective dose is the average dose of drug that will provide a therapeutic response in 50% of patients; represented as ED50.
The nurse needs to recognize that not all patients will experience the desired effect of a drug at the average dose, but may need adjustments in dosage.
The median lethal dose (LD50) is determined by the dose at which 50% of laboratory animals die during clinical studies.
The therapeutic index is the ratio of a drug’s LD50 to its ED50. The higher this value, the safer the medication.
In comparison, the median toxicity dose (TD50) is the dose at which 50% of patients will experience toxic effects of the drugs. This dose has more practical clinical application than the lethal dose.
The margin of safety (MOS) is calculated as the amount of drug that is lethal to 1% of animals (LD1) divided by the amount of drug that produces a therapeutic effect in 99% of the animals (ED99). This is another index of safety.
The dose–response relationship describes how the actions of a drug change with increasing dose.
The dose–response curve provides a graphical representation of patient response to varying drug doses.
The three distinct phases of the dose-response curve are: phase 1 which indicates a subtherapeutic effect; phase 2 which reflects the most desirable range; and phase 3 which represents the point at which a plateau has been reached.
When drug dosing hits a plateau, additional dose increases will not provide further therapeutic responses and may cause adverse effects.
Potency is the amount of drug needed to produce a specified effect.
Efficacy is the drug’s ability to produce the greatest maximal response. It compares the desired therapeutic effect of two drugs.
Drugs within the same class or in different classes can be compared in terms of their potency and efficacy. Of the two, efficacy is more important in terms of pharmacotherapeutic effects.
Receptor theory states that the majority of drugs produce therapeutic effects by stimulating or inhibiting receptor sites.
The response of a drug is proportional to the concentration of receptors that are bound or occupied by the drug.
Drugs that have the ability to bind to a receptor and produce a strong action are said to have high intrinsic activity.
Drug receptor binding is like a lock and key.
Once occupied, receptor triggers second messenger events, biochemical events occur, and the drug stimulates or inhibits the normal activity of the cell.
The discovery of receptor subtypes (two basic types are alpha and beta) paved the way for the development of more specific drug therapies.
Some drug actions result in nonspecific cellular responses and are independent of cellular receptors.
Agonists activate or bind to receptors and produce the same action of the endogenous chemical triggered by that receptor. The response may be greater than that of the endogenous activity.
Partial agonists produce a lesser endogenous effect.
Antagonists prevent the endogenous activity of the receptor. They may compete with the agonist or block excess endogenous activity.
Antagonists do not have intrinsic activity
Functional antagonists inhibit the effects by changing pharmacokinetic factors.
Many drug–drug and drug–food interactions can be explained by the relationships that occur between agonists and antagonists.
It is hoped that future drugs can be customized for patients using data from the Human Genome Project and other advances in medicine.
Pharmacogenetics is the branch of pharmacology that studies the role of genetic variation in drug responses.
It is hoped that the use of pharmacogenetic information may someday allow for drug therapy that is customized to a patient’s individual molecules.
Adams and Urban, Pharmacology: Connections to Nursing Practice, 3e
Instructor’s Resource Manual
Copyright 2016 by Education, Inc.
|
|
Comments (0)
|
Post your homework questions and get free online help from our incredible volunteers
|