|
|
A free membership is required to access uploaded content. Login or Register.
PCS 125 - Sound waves and Beats Lab Report 2012
|
|
Uploaded: 6 years ago
Category: Engineering
Type: Report
Rating:
N/A
|
Filename: phy lab report-sound wave & beats.docx
(66.57 kB)
Page Count: 1
Credit Cost: 1
Views: 515
Downloads: 2
Last Download: 3 years ago
|
Description
PCS 125 physics: waves and fields
Transcript
RYERSON UNIVERSITY
DEPARTMENT OF PHYSICS
LAB REPORT
FOR
PCS125 SECTION
TITLE OF EXPERIMENT: Sound waves and Beats
EXPERIMENTERS:
(Full names and ID’s)
AUTHORS OF THIS REPORT:
EXPERIMENT PERFORMED ON (DATE): February 1st, 2012
REPORT SUBMITTED ON (DATE): February8TH, 2012
TA’S NAME:
OBJECTIVE AND BACKGROUND:
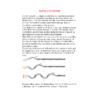
Sound wave is a longitudinal wave that disturbed by air pressure through air medium. The microphone diaphragm can be used to detect and record sound wave vibration by moving in direction of air pressure. However, when two sound waves of nearly the same frequency are overlapping their air pressure will combine to create a beat according to the principle of linear superposition. The purpose of this lab; however, is to measure and observe experimentally the amplitude, period and frequency of different sound wave and the overlapping of two different sound waves to produce beat by using vernier computer interfere, tone generator software and vernier microphone. Therefore, this lab divided into two parts. Firstly, calculate the frequency, period and amplitude of different sound wave by producingsound from the tone generator using microphone diaphragm. Also, measuringthe effect of changing the frequency on the period and amplitude by using different frequencies value (440 Hz and 442 Hz) andthenrecord the values of the period and amplitude fromthe sinusoidal graph that obtained by using these formulas;
y=Asin (2f t)
Where:
A is the amplitude of the wave (the maximum or minimum position)
f is the frquecny
y is the change in air pressure
t is the time in second
The period of the sound wave can be obtain by calculating the reciprocal of the frequency as shown in this formula,
f=1/T
Where T (period) is the reciprocal of the frequency.
Secondly, we have calculate the beat frequency by using different frequency values (440 Hz and 444 Hz) one each timeand by setup two different tone from the tone generator using vernier microphone to determine the beat pattern and to observe the relationship between beat frequency and the interfering of different sound frequency.
In conclusion to all the equations that are shown above, the graphs and observation will clarify each one in their way.
MATERIALS
Computer
Logger pro
Vernier computer interfere
Tone generator software
Vernier microphone
Fig:1Computer 3 Fig:2 Logger pro
Fig:3 Vernier computer interfere Fig:4 Vernier microphone
Fig:5Tone generator software
PROCEDURE
Two parts were determined in this experiment. In the first part, we have measured the frequency, amplitude and period by using different frequencies and tone generator using microphone diaphragm to collect the sound wave. In the second part, we have observed the beat frequency by the overlapping of two different sound waves.
Part I simple waveform
In the first part the amplitude, period and frequency was measured by using different sound wave.
The microphone was connected to channel 1 of computer interfere.
“32 Sound Wave”, file from the physics with vernier folder was opened. The variation of air pressure represented by the vertical axis and the waveform on the time axis was centered by clicking on zero buttons.
A sound was produce from the tone generator and the microphone hold close to it to detect the sound wave and then the collect buttons was clicked to collect the data.
The number of cycles in the sinusoidal graph was count and recorded.
The examine buttons was hit and the mouse dragged over the same number of complete cycles of the waveform. Then, the time interval (t) was divided by number of cycles to compute the period of the sound.
The frequency of the sound was calculated and recorded in the data table 1.
The amplitude of the waveform was determined by dragging the mouse over the graph from top of the peak to the bottom of the trough. The amplitude was computed by taking half of the differences y and then the value was recorded in the data table 1.
A sketch of graph was made.
The data was saved by clicking on the Store Latest Run buttons from the experiment menu. Hide Data Set from the data menu was then hit to hide the run and Run 1 was selected to hide the data.
Step 3 to 8 was repeated using different frequencies about 1 or 2 Hz difference.
The last run was stored as Run 2 and then the run was hidden in the same manner as run 1.
Part II beats
In the second part the beat was observed by using two different tones with different frequency.
Two slightly different tones form part I was setup at the same time.
The data was collecting while the two tones are sounding. The time variation of the sound amplitude was observed. Store latest Run was clicked from experiment menu and then the beat waveform was stored as Run 3.
The number of amplitude maxima was counted and recorded in the data table after the first maximum.
The time interval for numerous complete beat was determined by clicking on the Examine buttons. Then, the period of the beats in seconds was calculated by divided the time interval by the number of cycles. The beat frequency was computed from the beat period.
The value of the beat frequency was calculated and recorded in the data table.
OBSERVATION
Part 1
Trial no
Setup tone generator frequency (Hz)
Number of cycles
?t (s)
Period (s)
Calculated frequency (Hz)
Amplitude (arbitrary)
1
440
11
0.0250
2.27×10^-3
440
0.237
2
440
10
0.0228
2.28×10^-3
439
0.175
3
441
14
0.0318
2.27×10^-3
440
0.167
Table 1: Period, frequency and amplitude of simple waveforms
Part 2
Trial no
Tone 1 frequency(Hz)
Tone2 frequency (Hz)
Overlapped tones number of cycles
?t (s)
Beat periods (s)
Calculated beat frequency (Hz)
1
440
442
5
2.509
0.502
1.992
2
440
442
8
4.002
0.500
2.000
Table 2: Beats
CALCULATION
Part 1
Trial 1
Period = ?t (s)/ number of cycles
= 0.0250
11
= 2.27×10^-3 s
Frequency = 1
Period
= 1/ 2.27×10^-3
= 440 Hz
Trial 2
Period = ?t (s)/ number of cycles
= 0.0228
10
= 2.28×10^-3 s
Frequency = 1
Period
= 1/ 2.28×10^-3
= 439 Hz
Trial 3
Period = ?t (s)/ number of cycles
= 0.0318
14
= 2.27×10^-3 s
Frequency = 1
Period
= 1/ 2.27×10^-3
= 440 Hz
Part 2
Trial 1
Period = ?t (s)/ number of cycles
= 2.509
5
= 0.502s
Frequency = 1
Period
= 1
0.502s
= 1.992 Hz
Trial 2
Period = ?t (s)/ number of cycles
= 4.002
8
= 0.500s
Frequency = 1
Period
= 1
0.500s
= 2.00 Hz
ANALYSIS
In part1, simple waveform fits the sine function model with the data. From tone 1
y=A sin (Bt+ C) + D
y= 0.2299 sin (2764t+ 1.218) -0.0003869
B= 2f
2764= 2f
f= 439.90 Hz
This frequency is similar to the setup tone generator frequency which is 440Hz.
For tone 2
y= 0.1675sin (2768t+ 3.014) - 4.265
B= 2f
2768= 2f
f=440.5 Hz
Setup tone
Parameter A
Parameter B
f = b/2
Tone1
0.2299
2764
439.90
Tone2
0.1675
2768
440.5
Table 3: parameters of sinusoidal curve fit
The frequency from the curve fit is similar to the frequency that is calculated, but still the curve fit frequency is more accurate than the calculated ones because there is less chances of calculation errors.
Extensions
Y1 = A sin (2f 1t)
Y2 = A sin (2f 2t)
Y1+Y2 = A sin (2f 1t) + A sin (2f 2t)
= A [2 sin (2?f 1 + f 2}t) × cos (2?f 1 - f 2}t)]
2 2
Amplitude = A× cos (2?f 1 - f 2}t)
2
Frequency
B= 2?f 1 + f 2}
2
f = f 1 + f 2
2
DISCUSSION AND RESULTS
Beats are the periodic and repeating fluctuations heard in the intensity of a sound when two sound waves of very similar frequencies interfere with one another. The beat frequency refers to the rate at which the volume is heard to be oscillating from high to low volume. The beat frequency is always equal to the difference in frequency of the two notes that interfere to produce the beats. So if two sound waves with frequencies of 440 Hz and 442 Hz are played simultaneously, a beat frequency of 2 Hz will be detected. This is proved in the second part of the experiment.
CONCLUSION
References:
http://www.physics.ryerson.ca/labs/PCS125
http://www.physics.ryerson.ca/sites/default/files/u11/exp/exppcs125/SoundWavesBeatsV3.pdf
|
|
Comments (0)
|
Post your homework questions and get free online help from our incredible volunteers
|