|
|
A free membership is required to access uploaded content. Login or Register.
CHE 215 - Gas pressure loss and venturi flowmeter lab report
|
|
Uploaded: 6 years ago
Category: Chemical Engineering
Type: Report
Rating:
N/A
|
Filename: Calcuation for Experiment 9-Process Measuremnt.docx
(36.12 kB)
Page Count: 5
Credit Cost: 1
Views: 227
Last Download: N/A
|
Description
CHE 215 Process Measurements
Transcript
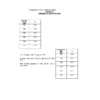
Experimental Data and Result Sheet
Experiment 9
Gas pressure loss and venturi flowmeter
Flow Scale-
Reading
FLOWRATE
(ft3/s)
Pressure loss
(in W.C, inch of water column)
Flow system
(pipe, orifice, or venture)
100
0.0317
78.45
95
0.0283
71.54
92
0.0267
64.81
90
0.0257
55.29
85
0.0217
35.37
82
0.02
30.99
80
0.0133
18.76
1266825177800 Air temperature 25oC
1 atm = (33.9 x 12) inches of water column (in WC)
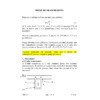
Calculations:
Calculate the Reynolds number of each flow setting. (Pipe I.D. = 0.6 in)
Conversions:
Density of the air (?) = 1.1839 kg/m3
95249928194000The density of the fluid was converted to U.S customary unit:
23050491079500 1.1839 kg 2.20462 lbm 1 m3
m3 kg 35.3147 ft3
? air = 0.0739 lbm/ft3
Fluid Viscosity
857250283210Conversions of Air Viscosity:
18.27 Pa.s 0.672 lbm
ft s
? µ = 12.2774 lbm/ ft. s
Diameter:
Diameter of the Pipe =0.6 in.
166687529845000 1 ft= 12 in
? D Pipe = 0.6 in 1ft
12 in
= 0.05 ft
Volumetric flow rate:
The volumetric flow rate for seven trials for the air in pipe was calculated as shown below:
1.9 ft3 60 min 1hr
min 1hr 3600s
? Q= 0.0317 ft3/s
Calculation of the Re number:
Reynolds number for the pipe and orifice was calculated as shown for trial #1 below:
Re pipe = 4 ? Q/ µ ? d
= (4 * 0.0739 * 0.0317) / (12.2774 * ?* 0.05)
= 0.00486
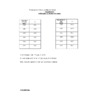
Table1. NRe of the Air in the Pipe
Trial #
Air Flow rate Q (ft3/s)
Re Pipe
Pressure Drops P (psia)
1.
0.0317
0.00486
2.835
2.
0.0283
0.00434
2.585
3.
0.0267
0.00409
2.342
4.
0.0257
0.00394
1.998
5.
0.0217
0.00333
1.278
6.
0.0200
0.00307
1.12
7.
0.0133
0.00204
0.678
Conversions of the Pressure loss of the air in the Pipe for trial #1:
2.835 psia 1atm (33.9x12in)
14.7psia 1atm
? P= 78.45 WC
Table2. The Air Pressure loss in pipe
Trial #1
Pressure loss in W.C
1
78.45
2
71.54
3
64.81
4
55.29
5
35.37
6
30.99
7
18.76
References:
efunda “ Properties of Air “ http://www.efunda.com/materials/common_matl/show_gas.cfm 2013
A Graph of Pressure Loss and Re number the in Pipe
|
|
Comments (0)
|
Post your homework questions and get free online help from our incredible volunteers
|