Transcript
Exponential Functions
Properties of the Graph f(x) = ax
Intercepts
To find the vertical intercepts, substitute x = 0 into f(x) = ax. Equating zero for the exponent x yields a value of 1 (as anything raised to the zero power is one). Therefore, the vertical intercept is 1.
To determine the horizontal intercepts, substitute f(x) = 0. The function has no real solution because ax > 0 for all real values of x. Therefore, the x-axis is an asymptote.
Domain & Range
Because a > 0, we define ax for all real values of x. Also because ax is positive for all values of x, the range is the set of all positive real numbers.
Critical Points
There appears to be no critical points on the graph of f(x) = ax.
Intervals of Increase/Decrease
When a > 1, the function increases for all x-values.
When 0 < a < 1, the function decreases for all x-values.
When a = 1, the function is constant.
Points of Inflection
Because the function is either always increasing, decreasing, or is constant, there are no points of inflection: the graph never changes concavity.
Concavity
All functions of the form y = ax are concave up – with the notable exception when a = 1.
Asymptote
For all values of a > 1, as x decreases through the negative values, the graph approaches the x-axis, but never touches it.
When 0 < a < 1, as x increases, the points of the graph approach the x-axis, but never touch it.
Therefore, generally one can make the statement: The x-axis is an asymptote for all graphs of the function f(x) = ax.
Points of Discontinuity
There are no points of discontinuity in existence on the graphs of the function.
Law of Exponents
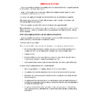
Shown below is the graph of y = 2x:
Suppose we pick two arbitrary points on the graph: A(-1, ½) and B(3, 8). If we add the x-coordinates and multiply the y-coordinates, the result is another point on the graph: C(2, 4).
Therefore, adding the x�-coordinates and multiplying the y-coordinates of two points produces the coordinates of a third point on the graph. This is a result of the law of exponents for multiplication. This applies for all graphs of the form y = ax for any value of a.
Multiplicative Growth and Decay
Compound Interest
Suppose an investment of $500 at a fixed interest rate of 6.5% compounded annually is made. The amount (A) dollars of the investment after n years is given by the equation A = 500(1.065)n. As the number of periods (n) passes by, the amount will grow exponentially. The value for n is a natural number (because it represents the number of years) greater than 1.
How Long Caffeine Stays in Your Bloodstream
Coffee, tea and carbonated drinks contain caffeine. When you consume caffeine, the perecent P left in your body can be modelled as a function of the time elapsed, n hours, by the equation P = 100(0.87)n. The percent decreases with time.
Comparing the Equations
The two previous situations are examples of exponential growth and decay. Consider the similarities of the two functions:
Exponential Growth
A = 500(1.065)n
Based on this, we can apply the rule that if the factor is more than one it is a growth factor, and less than one it is a decay factor.
The Function y = ex
Deriving Exponential Functions
Based on graphs of the function, f(x) = ax, with varying a values, we can make the following conclusions:
d/dx (ax) = kax, where k is a constant that depends on the value of a.
When a ? 2.7, the graph of f’ appears to coincide with the graph of f. d/dx (ax) = ax
When a > 2.7, the graph of f’ is a vertical expansion of the graph of f. d/dx (ax) > ax
When a < 2.7, the graph of f’ is a vertical compression of the graph of f. d/dx (ax) < ax
The conclusions we drew can be validated by applying the first-principles definition of the derivative to the function:
Introducing the Function y = ex
Each of the five graphs shown below shows an exponential function and its derivative. These functions appear to coincide on the middle graph. Therefore, logically, there should be a value of a near 2.7 such that equation 1 becomes . For this value of a,
To determine this value for a, substitute numbers close but not equal to 2.7 and a very small number for h, say h = 0.000 001. To 5 decimals the number a for which ¸ is 2.718 28. We represent this value for a with the letter e. Using this value of a, equation 1 becomes
.
The function is y = ex.
Logarithmic Functions
Definition of Logarithmic Functions
The Definition of loga x
The expression loga x is an exponent. It is the exponent that a has when x is written as a power of a.
loga x means ay = x, where a >0, a =1 and x > 0.
To remember this definition,
Properties of the Graph f(x) = loga x
Determining the Inverse of an Exponential Function
Let y = 2x
Step 1: Take the base 2-logarithm of both sides.
Step 2: Solve for x.
Step 3: Interchange x and y.
We can determine the inverse of any function by reflecting its graph in the line
y = x. The function y = loga x is defined to be the inverse of the function y = ax, where
a > 0, a = 1.
Properties of the Graph
Intercepts
f-1(x) = logax
To determine the vertical intercept, substitute x = 0.
f-1(0) = loga0
To determine the value of log a0, let loga 0 = y, and then ay = 0. Hence, loga 0 is undefined. There is no vertical intercept.
To determine the horizontal intercepts, solve f-1(x) = 0
Then, logax = 0, or x = a0
Since a0 = 1, x = 1
The horizontal intercept is 1.
Domain and Range
Since we can define logax for all positive values of x and the domain is the set of positive real numbers:
D = {x | x > 0, x ? R}
The range is the set of all real numbers:
R = {y | y ? R}
Critical Points
There are no critical points, which will be proven in Section 4: Derivatives of Logarithmic Functions.
Intervals of Increase and Decrease
We can determine the intervals of increase and decrease from the graphs.
Points of Inflection
There are no points of inflection, which will be proven in Section 4: Derivatives of Logarithmic Functions.
Concavity
The graph will be concave up when a > 1. For 0 < a < 1. This will be proven in Section 4: Derivatives of Logarithmic Functions.
Asymptote
As x decreases and approaches 0, the points on the graph come closer to the y-axis, but never reach it.
The y-axis is an asymptote.
Points of Discontinuity
There are no point discontinuities.
Law of Logarithms
The graph of y = log2x is shown below:
Select any two coordinates on the graph, such as A (1/2, -1) and B (8, 3).
Add their y-coordinates: -1 + 3 = 2
Multiply their x-coordinates:
1/2 x 8 = 4
The results are the coordinates of another point F (4, 2) on the graph.
This property is a consequence of the law of logarithms for multiplication: that is, the sum of two logarithms with the same base is the logarithm of their product. Therefore, this law applies to the graph of y = log2 x
Proofs of Logarithmic Laws
Law of Logarithms for Powers
THEOREM If x and n are positive real numbers, then,
PROOF Let loga x = m
Step 1: Write the equation in exponential form.
Step 2: Raise each side to the nth power.
Step 3: Take the base-a logarithm of both sides.
If x and n are positive real numbers, then
Law of Logarithms for Multiplication
THEOREM If x and y are positive real numbers, then,
PROOF Let loga x = m, loga y = n
Step 1: Write the equations in exponential form.
Step 2: Multiply left and right sides.
Step 3: Take the base-a logarithm of both sides.
If x and n are positive real numbers, then
Law of Logarithms for Division
THEOREM If x and y are positive real numbers, then,
PROOF Let loga x = m, loga y = n
Step 1: Write the equations in exponential form.
Step 2: Divide left and right sides.
Step 3: Take the base-a logarithm of both sides.
If x and n are positive real numbers, then
Natural Logarithms
Because we know that the derivative of y = ex is y’ = ex, it is easier to deal with logarithms to the base e as opposed to the base ten (when dealing with log10). Base e logarithms are called natural logarithms. We can use the lawn or “LN” key on the calculator to determine these values. For example:
ln 74.45 ? 4.3101 This means that e4.3101 = 74.45.
Definition of ln x
The expression ln x is an exponent. It is the exponent that e has when x is written as a power of e.
ln x = y means ey = x, where x > 0.
To remember the definition of ln x think:
Derivatives of Exponential Functions
Differentiating y = ex …… y = ef(x)
We define e to be the number such that . To 5 decimals, e = 2.718 28
The derivative of y = ex is the function itself.
To derive the function y = ef(x), use the chain rule.
Differentiating y = ax
THEOREM The derivative of y = ax is proportional to the function. The constant of proportionality is ln a.
PROOF Let a = ek (Change the function to base-e)
Step 1: Solve for k by taking the ln of both sides.
Step 2: Substitute for k in the original equation to express a as a power with base-e.
Step 3: Substitute for a in y = ax.
Step 4: Differentiate using Chain rule.
The derivative of y = ax is proportional to the function. The constant of proportionality is ln a.
The Derivative of y = af(x)
To differentiate this function, where f(x) is differentiable, use the chain rule.
Derivatives of Logarithmic Functions
Differentiating y = ln x …. y = ln f(x)
The Derivative of y = ln x
To differentiate the function, write the equation in exponential form.
This is an implicit equation, so differentiate with respect to x.
Therefore, the derivative of ln x is:
The Derivative of y = ln f(x)
To differentiate this function, where f(x) is differentiable, use the chain rule.
Differentiating y= loga x
The Derivative of y = loga x
Write the equation in exponential form:
Differentiate relative to x.
Therefore, the derivative of y = loga x is:
Applications
Equations of Exponential Functions
The equation of any exponential function can be expressed in two forms. In each case, y0 is the value of y when x = 0.
Basic Form y = y0(1 + r)x
r represents the average rate of change (a percent expressed in decimal form).
In growth situations, r > 0; in decay situations, -1 < r < 0
Base e Form y = y0 ekx
k represents the instantaneous rate of change (a percent expressed in decimal form).
In growth situations, k > 0; in decay situations, k < 0
We can differentiate the equation in base-e form more easily than the equation in basic form. The derivative, y’ = ky0 ekx, is k time the function; that is, y’ = ky
9
9