Hi tsing_lee
Sorry about the spam post earlier, we've deleted it.
I noticed that this figure was obtained from https://academic.oup.com/mbe/article/38/8/3383/6237498
Is that were you got it from? Did you read the description on the figure?
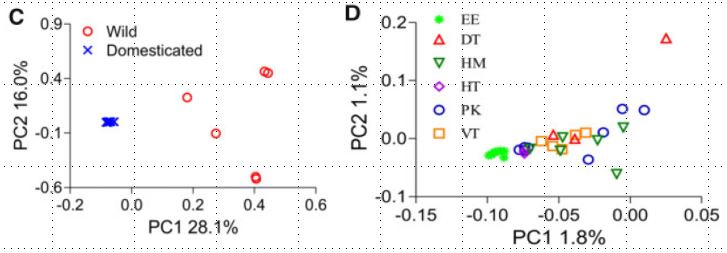
Genetic diversity and population structure in fighting fish. (A and B) Differences of genetic diversity between domesticated and wild fish measured in nucleotide diversity and number of rare alleles, respectively. P values for t-test are shown above. (C and D) Population structure among domesticated and wild fish, and within domesticated fish, respectively, revealed by principal component analysis. EE, elephant ear; DT, double tail; HM, halfmoon tail; HT, horse tail; PK, Plakat tail; VT, veil tail. (E) The most likely number of genetic clusters (K) is inferred as 3, where shows the lowest cross-validation errors. (F) Population structure at individual level revealed by admixture analysis, at K = 2 and 3, in domesticated fish. Major traits including body color (– indicates too complicated color pattern to phenotype, whereas T and W indicate transparent and white coat color, respectively) and fin shape (codes are corresponding to those in D), for each individual, are also shown below.
Get back to me soon...