|
Exercise 5, Cardiovascular Dynamics, p.63
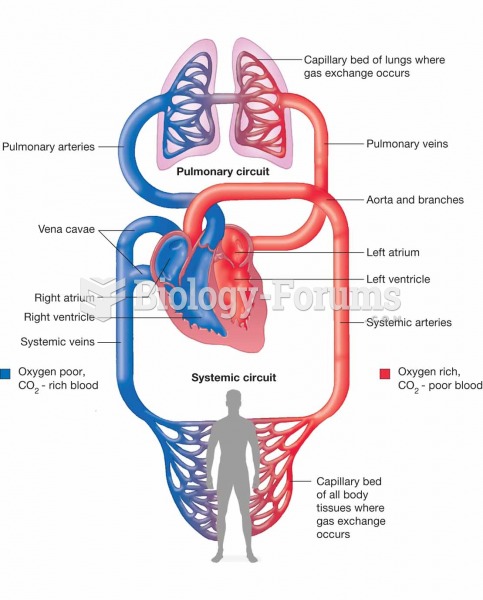
Introduction: In this lab we learn about blood circulation in the body, how the heart pumps blood to organs in the body and how alteration in blood flow can lead to disease and Pathophysiology.
Activity 1: Studying the Effect of Flow Tube Radius on Fluid Flow
Data:
Flow Radius Viscosity Length Pressure
4.0 1.5 1.0 50 100
12.6 2.0 1.0 50 100
30.7 2.5 1.0 50 100
63.6 3.0 1.0 50 100
117.8 3.5 1.0 50 100
201.0 4.0 1.0 50 100
321.9 4.5 1.0 50 100
490.6 5.0 1.0 50 100
718.3 5.5 1.0 50 100
1017.4 6.0 1.0 50 100
Studying the Effect of Flow Tube Radius on Fluid Flow
Questions: Please answer the questions in complete sentences and explain your answers.
1. What happened to the fluid flow rate as the radius was decreased? The flow rate was decreased.
2. Is the relationship between the fluid flow rate and the flow tube radius linear or exponential? The relationship is exponential.
3. In atherosclerosis, vessels become thickened because of deposits of cholesterol and plaque formation. Do you think that flow would be faster or slower in areas of plaque formation? The flow rate would be slower in areas of plaque formation.
4. How does driving pressure affect fluid flow? Driving pressure keeps the fluid flowing.
Summary:
In this Activity, I learned/observed that: How deposits of cholesterol effects blood flow through vessels in the body. If vessels become thickened with sludge, it would be harder for the fluid to travel through causing a decrease in fluid flow.
Activity 2: Studying the Effect of Viscosity on Fluid Flow
Data:
Flow Radius Viscosity Length Pressure
490.6 5.0 1.0 50 100
245.3 5.0 2.0 50 100
163.5 5.0 3.0 50 100
122.7 5.0 4.0 50 100
98.1 5.0 5.0 50 100
81.8 5.0 6.0 50 100
70.1 5.0 7.0 50 100
61.3 5.0 8.0 50 100
54.5 5.0 9.0 50 100
49.1 5.0 10.0 50 100
Studying the Effect of Viscosity on Fluid Flow
Questions: Please answer the questions in complete sentences and explain your answers.
1. How does viscosity affect the fluid flow rate? Fluid flow decreases, as viscosity is increased.
2. What effect does anemia have on blood flow? Anemia would result in fewer red cells than normal, which would decrease the viscosity of the blood.
3. Dehydration results in increased blood viscosity, how would this affect blood flow? There would be a decrease in blood flow.
4. Is fluid flow versus viscosity and inverse or direct relationship? Fluid flow versus viscosity is an inverse relationship.
Summary:
In this Activity, I learned/observed that: How viscosity affects blood flow rate. The higher the viscosity, the slower the blood flow will be. And the lower the viscosity, the faster the blood flow rate would be.
Activity 3: Studying the Effect of Flow Tube Length on Fluid Flow
Data:
Flow Radius Viscosity Length Pressure
700.9 4.0 3.5 10 100
467.3 4.0 3.5 15 100
350.4 4.0 3.5 20 100
280.4 4.0 3.5 25 100
233.6 4.0 3.5 30 100
200.3 4.0 3.5 35 100
175.2 4.0 3.5 40 100
155.8 4.0 3.5 45 100
140.2 4.0 3.5 50 100
Questions: Please answer the questions in complete sentences and explain your answers.
1. How does flow tube length affect fluid flow? Increasing the flow tube rate caused a decrease in fluid flow, so the shorter the length the faster the flow.
2. At what flow tube length was the flow rate the highest? The flow tube rate was the highest at 10mm in length. Please explain your result. As I gradually increased the length of the flow tube, the fluid flow rate was decreasing as well.
Summary:
In this Activity, I learned/observed that: Fluids flow faster when the flow tube length is shorter. As the flow tube length is increased, the fluids began to flow slower.
Activity 4: Studying the Effect of Pressure on Fluid Flow
Data:
Flow Radius Viscosity Length Pressure
35.0 5.0 3.5 50 25
70.1 5.0 3.5 50 50
105.1 5.0 3.5 50 75
140.2 5.0 3.5 50 100
175.2 5.0 3.5 50 125
210.3 5.0 3.5 50 150
245.3 5.0 3.5 50 175
280.4 5.0 3.5 50 200
315.4 5.0 3.5 50 225
Studying the Effect of Pressure on Fluid Flow
Questions: Please answer the questions in complete sentences and explain your answers.
1. How does driving pressure affect fluid flow rate? The greater the pressure is, the faster the flow rate is.
2. In the body, where does the driving pressure for fluid flow come from? Driving pressure for fluid flow rate comes from the heart in the body.
Summary:
In this Activity, I learned/observed that: The effect that high blood pressure has on the flow of blood. If the blood pressure is high, blood flows faster through vessels in the body.
Activity 5: Studying the Effect of Radius on Pump Activity
Data:
Flow Rad. L Rad. R Str. V Rate Press. L Press. Dif. R
3310.0 3.0 2.5 70 47.3 40 40
5086.8 3.0 3.0 70 72.4 40 40
6607.2 3.0 3.5 70 94.4 40 40
7728.3 3.0 4.0 70 110.4 40 40
8495.5 3.0 4.5 70 121.4 40 40
9006.4 3.0 5.0 70 128.7 40 40
9346.3 3.0 5.5 70 133.5 40 40
9575.2 3.0 6.0 70 136.8 40 40
Questions: Please answer the questions in complete sentences and explain your answers.
1. What is the relationship between flow rate and vessel radius? The bigger the radius is of the vessel, the higher amount of blood that will flow through the vessel.
2. How does the change in vessel radius affect the flow rate? Each time the radius of the vessel increased, the blood flow rate became greater.
Summary:
In this Activity, I learned/observed that: The radius of a vessel affects the amount of blood that is pumped into the aortic semilunar valve. The bigger the radius is of the vessel, the larger the amount of blood that is pumped into the valve.
Activity 6: Studying the Effect of Stroke Volume on Pump Activity
Data:
Flow Rad. L Rad. R Str. V Rate Press. L Press. Dif. R
5086.8 3.0 3.0 10 508.7 40 40
5086.8 3.0 3.0 20 254.3 40 40
5086.8 3.0 3.0 30 169.6 40 40
5086.8 3.0 3.0 40 127.2 40 40
5086.8 3.0 3.0 50 101.7 40 40
5086.8 3.0 3.0 60 84.8 40 40
5086.8 3.0 3.0 70 72.7 40 40
5086.8 3.0 3.0 80 63.6 40 40
5086.8 3.0 3.0 90 56.5 40 40
5086.8 3.0 3.0 100 50.9 40 40
5086.8 3.0 3.0 110 46.2 40 40
5086.8 3.0 3.0 120 42.4 40 40
Questions: Please answer the questions in complete sentences and explain your answers.
1. Describe the relationship between stroke volume and pump rate? The pump rate effects how much or how little the amount of fluid is ejected with each contraction.
2. Explain why a long distance runner’s resting heart rate is lower than a sedentary person. Please use your simulation results to explain your answer. An athlete has a higher stroke volume than a sedentary person; therefore the runner has fewer heart beats to obtain the same cardiac output.
Summary:
In this Activity, I learned/observed that: how pump rate affects the amount of fluids that is ejected from the heart. If the stroke volume is high, then the pump rate is decreased.
Activity 7: Studying Combined Effects
Flow Rad. L Rad. R Str. V Rate Press. L Press. Dif. R
5086.8 3.0 3.0 70 72.7 40 40
8365.7 4.4 3.0 70 119.5 40 40
9392.9 4.4 3.0 70 134.2 104 40
Studying Combined Effects
Questions: Please answer the questions in complete sentences and explain your answers.
1. What effect does increased hearting rate have on end diastolic volume? The faster the heart rate is, the higher the volume of blood that is pumped into the rest of the body.
2. How is the flow rate affected when the right flow tube radius is kept constant (at 3.0 mm) and the left flow tube radius is modified (either up or down)? An increase in the left tube radius causes a decrease in filling time and an increase in pump rate.
3. What happens to fluid flow when the right beaker pressure equals pump pressure? There isn’t enough driving pressure to force the fluid out of the pump.
4. Try manipulating the pressure delivered to the left beaker. How does changing the left beaker pressure affect flow rate? (This change would be similar to changing pulmonary vein pressure). Increasing the pressure in the left beaker increases fluid delivery to the pump from the left beaker.
5. What happens to the pump rate if the filling time is shortened? The pump rate increases if the filling time is shortened.
Summary:
In this Activity, I learned/observed that: Both pressure and radius affects filling time. If one tube is bigger than the other pump rate increases, but there is a longer filling time.
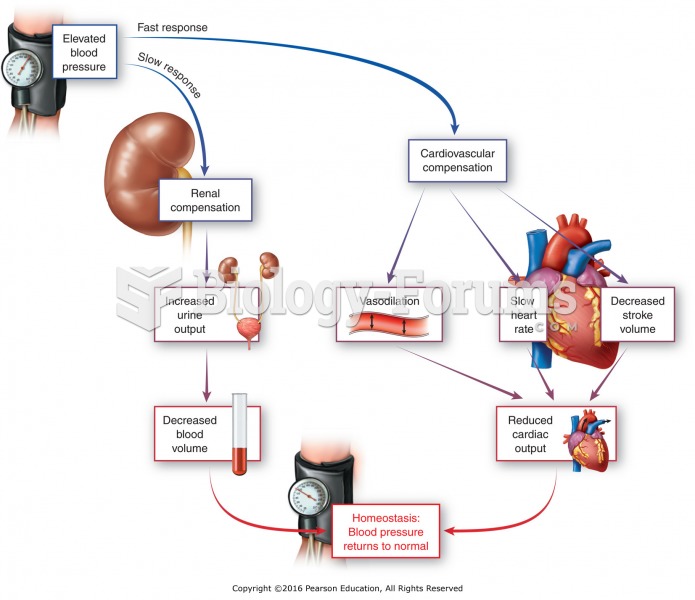
Activity 8: Studying Compensation
Flow Rad. L Rad. R Str. V Rate Press. L Press. Dif. R
5086.8 3.0 3.0 70 72.7 40 40
3310.0 3.0 2.5 70 47.3 40 40
Studying Compensation
Questions: Please answer the questions in complete sentences and explain your answers.
1. What happens if you decrease the right flow tube radius to 2.5mm? How does this affect flow rate to the rest of the body? When the radius of the flow tube was decreased to 2.5mm, the amount of the flow rate was decreased.
2. To increase or decrease blood flow to only a particular organ system, would it be better to adjust heart rate or blood vessel diameter? It would be better to adjust the blood vessel diameter.
3. Circle to correct term with the parentheses. Decreasing the right flow tube radius is similar to a partial (leakage/blockage) of the aortic valve or (increased/decreased) resistance in the arterial system.
4. Explain how the human heart would compensate for the above condition. The human heart would compensate for this condition by increasing its force of contraction to overcome the increased resistance.
5. There are systolic and diastolic causes of heart failure. Choose one of the causes of heart failure and state how the heart compensates for the failure and what changes occur in the body. If an artery in the body was partly filled by plague formation, the heart will need to generate more force to maintain blood flow and blood pressure would then be higher than normal.
|


 Quick Reply