× Didn't find what you were looking for? Ask a question
Top Posters
Since Sunday
5
a
5
k
5
c
5
B
5
l
5
C
4
s
4
a
4
t
4
i
4
r
4
New Topic  
hurinthalion17 hurinthalion17
wrote...
Posts: 2
Rep: 0 0
2 months ago Edited: 2 months ago, hurinthalion17
Hello fellow biologists,

I am seeking some assistance in deciphering an agarose gel electrophoresis image. The gel is a result of a molecular biology practical involving the amplification of specific genes from mushroom DNA. Here are the essential details:

DNA was extracted from freeze-dried mushrooms and then used in quantitative PCR (qPCR) to amplify two target genes.
One of the genes is a reference gene (beta actin), which is expected to be present in a single copy per cell.
The other gene is tyrosinase (related to polyphenol oxidase activities), where we used degenerate primers potentially targeting multiple gene copies.
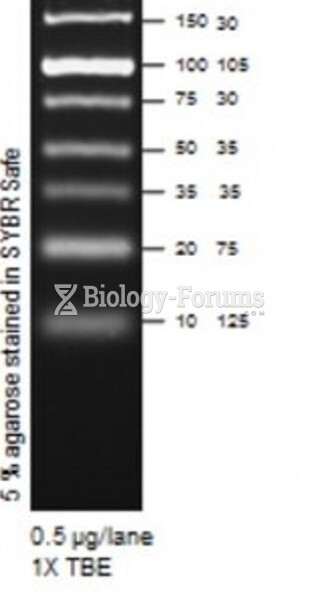
We used a 2% agarose gel to visualize the qPCR products and employed a DNA ladder to estimate fragment sizes.
Each lane was loaded with 10 µL of the sample, and the samples from each person were alternately loaded for the two gene targets.
The gel was run at ~70 V for approximately 60 minutes.
The image shows the gel post-run, with bands visible under UV light after staining with a fluorescent dye. I am looking to identify which bands correspond to the beta actin gene and which to the tyrosinase gene, as well as any insight you may have about anything else.

I hope this information is sufficient for an experienced eye. Could anyone help me interpret which lanes contain which gene products and what the band patterns might suggest about the gene copy number or amplification efficiency?

I was not present for the practical and thus I am having to figure this out on my own Face with Cold Sweat

Thank you in advance for your expertise!

I am not sure how to post the images here, but hopefully it will let me edit them in


Post Merge: 2 months ago


Here are the pictures :


Read 125 times
3 Replies

Related Topics

Replies
wrote...
Educator
2 months ago
Hi, welcome.

Before we can conclude definitively, the ladder you provided (photo 1), why isn't that being shown in the bottom two photos you provided below?


wrote...
2 months ago Edited: 2 months ago, hurinthalion17
Hi, welcome. Before we can conclude definitively, the ladder you provided (photo 1), why isn't that being shown in the bottom two photos you provided below?
The photos are separate files, I'm new here, I'm not sure how. But that ladder is to be placed next to both
Post Merge: 2 months ago

Hello everyone,

I'm looking for some help interpreting a gel electrophoresis image from a recent lab experiment on mushrooms. The gel showcases the results of a qPCR where we amplified two distinct targets: the reference gene β-actin and polyphenol oxidase (PPO) genes. Here's a brief overview of the experiment:

DNA was extracted from lyophilized mushrooms and used for qPCR with two sets of primers: one for β-actin and another set for PPO genes.
We ran a 2% agarose gel to visualize our qPCR products, using a pre-prepared DNA ladder for size reference.
The samples were loaded alternately for the two targets, with 10 µL per lane, and electrophoresis was carried out at ~70 V for 60 minutes.
The image shows the gel under UV illumination after staining with a fluorescent dye that binds to double-stranded DNA. What I need is to determine which bands correspond to the β-actin and which to the PPO genes, as well as any other insights you may have.

if you need more information please ask Slight Smile

Thank you very much for your time and expertise!

I was not present for the practical and thus I am having to figure this out on my own Face with Cold Sweat

Thank you in advance for your expertise!

I am not sure how to post the images here, but hopefully it will let me edit them in


Post Merge: 2 months ago


Here are the pictures :


Post Merge: 2 months ago

Hello fellow biologists,

I'm seeking your expertise to help annotate agarose gel electrophoresis images from a molecular biology practical that involved amplifying specific genes from mushroom DNA. The qPCR targeted two genes: beta actin (as a reference gene) and tyrosinase related to PPO activity. We used a 2% agarose gel and a DNA ladder for size estimation. My goal is to accurately identify the bands corresponding to the beta actin and PPO-related tyrosinase genes in the provided images.

Could anyone assist in annotating the lanes to indicate which bands correspond to the beta actin and which to the tyrosinase genes? Your guidance on this would be greatly appreciated.

Thank you in advance for your expertise!

I am not sure how to post the images here, but hopefully it will let me edit them in


Post Merge: 2 months ago


Here are the pictures :


wrote...
Educator
2 months ago
Sorry for the late response, the server was being updated yesterday and we did not get a chance to check our questions.

New Topic      
Explore
Post your homework questions and get free online help from our incredible volunteers
  1267 People Browsing
Related Images
  
 780
  
 1023
  
 739
Your Opinion
What percentage of nature vs. nurture dictates human intelligence?
Votes: 431