Awesome!
Moving on to this next question, I must say that I am kind of confused
Here is the question: 1. A) What does Figure 1C and 1D suggest about the evolution of the opsins in this species? B) What forces of evolution may have been occurring and WHY? C) Below is a phylogenetic tree of the known species relationships. How does knowing this help with your understanding of the evolutionary forces acting on the opsins in these species?
Here is the phylogenetic tree for part C:
https://imgur.com/0yBuA08So I'm kind of having problems understanding figure 1 as a whole, the introduction of the paper is all about figure 1 so that's my best bet of understanding the figure. I understood 1A and 1B but 1C and 1D I'm having problems...
1C and 1D are supposed to help me answer about the evolution of opsins in this species, maybe you can help me out and try to figure out what 1C and 1D mean and how I can use them to answer the question but here is what I understood.
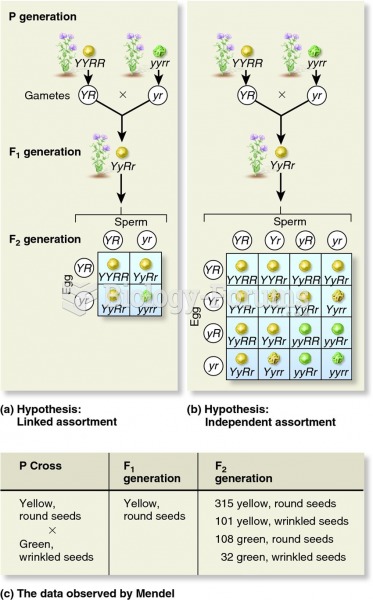
- Compound eye of shrimp has 3 distinct regions: dorsal and ventral hemispheres separated by an equatorial region referred to as the “midband” (MB) (this is figure 1B)
- In the second paragraph of the intro they talk about how shrimp has 6 rows of MBs, its retina has 16 photoreceptive units, with each ommatidium has 8 photoreceptive units (R1-8). So far I understand this.
- Still in the second paragraph, it says the hemispheres and the MB rows 5 and 6, the 8 photoreceptive units are further separated into two layers composed of seven retinula cells (R1-7) situated on a single celled eighth retinula. I'm kinda confused here , I understood the part about the R1-7 sitting on R8 as we see in figure 1D but didn't get the rest.
Anyways their is more paragraphs in the intro, but really I don't have to understand everytrhing about that figure, I just need to understand in a way that I can answer the question.
For part C, its clear that the shrimp (N. Oerstedii) shares a common ancestor with the other organisms shown and its clear that through gene duplication and mutation is why the current photoreceptor arrangement and spectral absorbance in the N. Oerstedii compound eye is the way it is. What yall think about this answer for part C?
But year parts A and B in regards to figure 1C and 1D Is tough

Now that I read more of the paper and reread the intro section a few times I feel like I don't need to understand every single thing to be able to answer how Figure 1C and 1D suggest about the evolution.
Obviously they have distinct dorsal, ventral hemispheres and an MB region which is distinct for this specific species (1C). However, they do share similarities to other crustaceans in that each ommatidium has 8 photoreceptor cells (1C). They do have very high spectral diversity (1C and 1D). In figure 1D we see that each wavelength is under different evolutionary pressures . All in all, the figures provide a deeper view into the function of the visual systems of this species, but they also show how this species has some super complex photoreceptor diversity. What this means to part B of the question is that the evolutionary forces that were likely occurring are probably opsin gene duplication and diversification because we see an increase in the visual system functional diversity of this species compared to others. Does this sound good for parts A and B of question 2? I feel like I'm missing some support when explaining why gene duplication and diversification is evident here?
But how does the phylogency from part C of that question tie into this? My thoughts is that when I look at the tree, I see our organism N. Oerstedii sharing a common ancestor with the preceding organisms and the fact that these perceding organisms do not have as much complex visual systems as our shrimp organism does, proves that gene duplication and diversification is likely. But i don't know this is just smth I wrote up now lol, maybe their is better answer?

 Quick Reply
")

")


")


")