|
|
A free membership is required to access uploaded content. Login or Register.
Mastering Biology Answer Keys (Chapter 26)
|
|
Uploaded: 3 years ago
Category: Biology
Type: Solutions
Rating:
N/A
|
Filename: Chap 26 (1).docx
(850.71 kB)
Page Count: 42
Credit Cost: 2
Views: 65
Last Download: N/A
|
Transcript
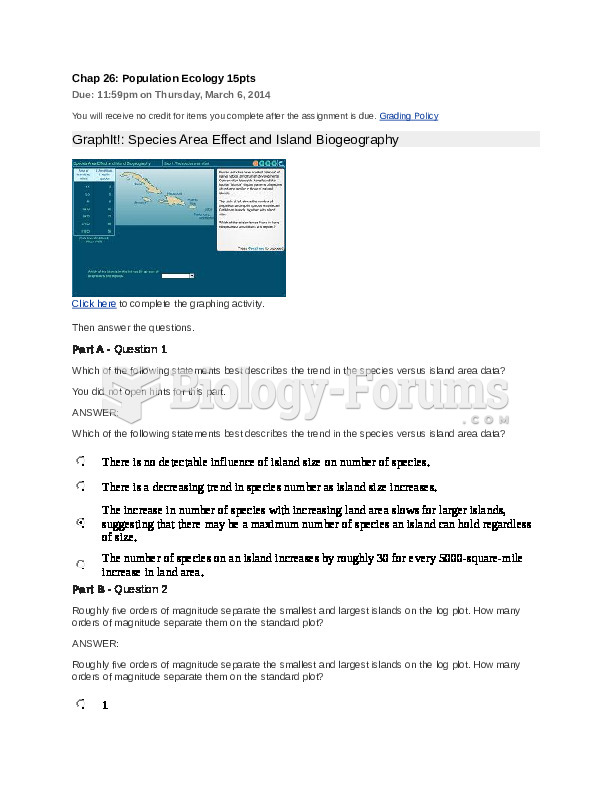
Chap 26: Population Ecology 15pts Due: 11:59pm on Thursday, March 6, 2014 You will receive no credit for items you complete after the assignment is due. Grading Policy GraphIt!: Species Area Effect and Island Biogeography Click here to complete the graphing activity. Then answer the questions. Part A - Question 1 Which of the following statements best describes the trend in the species versus island area data? You did not open hints for this part. ANSWER: Which of the following statements best describes the trend in the species versus island area data? There is no detectable influence of island size on number of species. There is a decreasing trend in species number as island size increases. The increase in number of species with increasing land area slows for larger islands, suggesting that there may be a maximum number of species an island can hold regardless of size. The number of species on an island increases by roughly 30 for every 5000-square-mile increase in land area. Part B - Question 2 Roughly five orders of magnitude separate the smallest and largest islands on the log plot. How many orders of magnitude separate them on the standard plot? ANSWER: Roughly five orders of magnitude separate the smallest and largest islands on the log plot. How many orders of magnitude separate them on the standard plot? 1 5 10 2 Part C - Question 3 If another island were present in the Caribbean that was about 1000 square miles in size, how many species of amphibians and reptiles would you expect to find on it? Choose the most likely number from the options below. You did not open hints for this part. ANSWER: If another island were present in the Caribbean that was about 1000 square miles in size, how many species of amphibians and reptiles would you expect to find on it? Choose the most likely number from the options below. 19 90 9 5 Part D - Question 4 Adjust the immigration rate curve so that its maximum value (on the Y-axis) is 4. Adjust the extinction curve so that its maximum is 2. Choose the number below that is closest to the predicted number of species on this island. ANSWER: Adjust the immigration rate curve so that its maximum value (on the Y-axis) is 4. Adjust the extinction curve so that its maximum is 2. Choose the number below that is closest to the predicted number of species on this island. 60 75 50 40 25 Part E - Question 5 Imagine a chain of islands of the same size that are at increasing distances from a mainland. The immigration rate should be highest for islands close to the mainland because they should receive the most colonizers. The extinction rate should be the same for all these islands. Use the equilibrium model of island biogeography to predict how the number of species on an island changes with distance from a mainland. Select the statement below that best represents your prediction. ANSWER: Imagine a chain of islands of the same size that are at increasing distances from a mainland. The immigration rate should be highest for islands close to the mainland because they should receive the most colonizers. The extinction rate should be the same for all these islands. Use the equilibrium model of island biogeography to predict how the number of species on an island changes with distance from a mainland. Select the statement below that best represents your prediction. The number of species increases with distance from the mainland. The number of species decreases with distance from the mainland. The number of species increases as island size increases. Immigration and extinction rates balance out so that there is no change in species number with distance from the mainland. BioFlix Activity: Population Ecology -- Types of Population Growth Can you identify the different ways in which populations grow? To review types of population growth, watch this BioFlix animation: Population Ecology. Part A - Types of population growth Drag the correct label under each graph to identify the type of population growth shown. ANSWER: BioFlix Activity: Population Ecology -- Exponential Growth Can you label the stages of exponential growth? To review this pattern of population growth, watch this BioFlix animation: Population Ecology: Exponential Growth. Part A - Exponential growth Drag the correct labels onto this graph showing exponential growth. Label the horizontal and vertical axes first. ANSWER: BioFlix Activity: Population Ecology -- Logistic Growth Can you label the stages of logistic growth? To review this pattern of population growth, watch this BioFlix animation: Population Ecology: Logistic Growth. Part A - Logistic growth Drag the correct labels onto this graph showing logistic growth. Label the horizontal and vertical axes first. ANSWER: BioFlix Activity: Population Ecology -- Density-Dependent and Density-Independent Factors Can you identify which factors are density-dependent and which are density-independent? To review density-dependent and density-independent factors, watch this BioFlix animation: Population Ecology: Density-Dependent and Density-Independent Factors. Part A - Density-dependent and density-independent factors Read the description below each image and determine whether it is an example of a density-dependent or density-independent factor. Drag the correct label below each image. Labels can be used more than once. ANSWER: BioFlix Activity: Population Ecology -- Comparing Growth Curves Can you label graphs showing different patterns of population growth? To review patterns of population growth, watch this BioFlix animation: Population Ecology: Population Growth Curves. Part A - Comparing growth curves Drag the correct labels onto the graph showing two different patterns of population growth. Label the horizontal and vertical axes first. ANSWER: BioFlix Quiz: Population Ecology Watch the animation at left before answering the questions below. Part A An ideal habitat with unlimited resources is associated with You did not open hints for this part. ANSWER: An ideal habitat with unlimited resources is associated with Exponential growth. Neither exponential growth nor logistic growth. Both exponential growth and logistic growth. Population crashes. Logistic growth. Part B The maximum population a habitat can support is its You did not open hints for this part. ANSWER: The maximum population a habitat can support is its Death rate. Birth rate. Exponential growth. Carrying capacity. Logistic growth. Part C Logistic growth involves You did not open hints for this part. ANSWER: Logistic growth involves Population growth slowing down as the population approaches carrying capacity. A population crash. Population growth reaching carrying capacity and then speeding up. Population size decreasing to zero. Population growth continuing forever. Part D In exponential growth You did not open hints for this part. ANSWER: In exponential growth Population growth slows as the population gets close to its carrying capacity. Population size grows more and more slowly as the population gets bigger. Population size grows faster and faster as the population gets bigger. Population size stays constant. None of these are correct. Part E Which of the following would NOT cause population size to decrease? You did not open hints for this part. ANSWER: Which of the following would NOT cause population size to decrease? Increase in the number of predators Increased birth rate Poor weather, resulting in less food being available An exponentially growing population outgrowing its food supply and crashing Increased death rate Interpreting Graphs and Data: Logistic Growth Can you interpret this graph about population growth to answer these questions? Part A What does the right y-axis represent? ANSWER: What does the right y-axis represent? resources, with quantity increasing from bottom to top time, with duration increasing from left to right population, with size increasing from bottom to top resources, with quantity decreasing from bottom to top Part B What does the orange graph line represent? ANSWER: What does the orange graph line represent? logistic growth exponential growth population size carrying capacity Part C Which of the following statements are true of logistic growth? Select all that apply. ANSWER: Select all that apply. As the population becomes larger, it grows more slowly. As the population becomes larger, it grows more and more rapidly. The population grows at a steady rate. When the population reaches carrying capacity, it stops growing. Part D Which of the following statements are true of a population at carrying capacity? Select all that apply. ANSWER: Select all that apply. The rate at which resources are used is equal to the rate at which they are supplied. The population growth rate equals zero. The birth rate equals the death rate. The population continues to grow at a constant rate. Part E As a population approaches carrying capacity, environmental resistance __________. ANSWER: As a population approaches carrying capacity, environmental resistance __________. increases remains constant cannot be determined from the graph decreases Part F Which of the following factors does not contribute to environmental resistance? ANSWER: Which of the following factors does not contribute to environmental resistance? weather conditions competition for space birth rate environmental toxins competition for food Part G This question will be shown after you complete previous question(s). Part H This question will be shown after you complete previous question(s). Part I This question will be shown after you complete previous question(s). Activity: Investigating Survivorship Curves Click here to complete this activity. Then answer the questions. Part A Which of these species typically has a mortality rate that remains fairly constant over an individual's life span? ANSWER: Which of these species typically has a mortality rate that remains fairly constant over an individual's life span? humans robins elephants oysters grasses Part B Oyster populations are primarily, if not exclusively, composed of _____. ANSWER: Oyster populations are primarily, if not exclusively, composed of _____. larval and juvenile oysters juveniles larvae adults prereproductive oysters Part C Which of these organisms has a survivorship curve similar to that of oysters? ANSWER: Which of these organisms has a survivorship curve similar to that of oysters? humans elephants grasses cats robins Part D Which of these organisms has a survivorship curve similar to that of humans? ANSWER: Which of these organisms has a survivorship curve similar to that of humans? cats grasses oysters elephants robins Interpreting Graphs and Data: Survivorship Curves of Albertosaurus and Four Modern Species Dr. Gregory Erickson studied the fossilized bones of a dinosaur called Albertosaurus to determine the age at which individual dinosaurs died. From this data he constructed a survivorship curve. The graph below compares the survivorship curve of Albertosaurus to that of four modern species. Can you interpret the graph to answer these questions? Source: Erickson, G.M., P.J. Currie, B.D. Inouye, A.A. Winn. 2006. Tyrannosaur Life Tables: An Example of Nonavian Dinosaur Population Biology. Science 313:213–217. Part A What is shown on the x-axis? ANSWER: What is shown on the x-axis? life span of individuals, expressed in 25-year intervals percentage of the maximum life span of a species number of survivors, on a logarithmic scale number of survivors, as a percentage of the population Part B Look closely at the scale on the y-axis. What number would be represented by the point midway between the tick mark labeled 10 and the tick mark labeled 100? ANSWER: Look closely at the scale on the y-axis. What number would be represented by the point midway between the tick mark labeled 10 and the tick mark labeled 100? approximately 5 approximately 32 approximately 55 approximately 68 Part C In a population of 1,000 elephants, how many individuals would survive for 50% of the species’ maximum life span? ANSWER: In a population of 1,000 elephants, how many individuals would survive for 50% of the species’ maximum life span? about 8 about 100 about 500 about 800 Part D According to the graph, which modern animal has a relatively constant mortality rate throughout its life span? ANSWER: According to the graph, which modern animal has a relatively constant mortality rate throughout its life span? elephant starling human crocodile Part E At 50% of maximum life span, how does the survivorship of Albertosaurus compare to the survivorship of the crocodile? ANSWER: At 50% of maximum life span, how does the survivorship of Albertosaurus compare to the survivorship of the crocodile? The survivorship of the two species is roughly equal. The survivorship of Albertosaurus is about 3 times greater than that of the crocodile. The survivorship of Albertosaurus is about 10 times greater than that of the crocodile. The survivorship of Albertosaurus is about 100 times greater than that of the crocodile. Part F Is the following statement supported or not supported by the data shown in the graph? The maximum life span of Albertosaurus was about 100 years. ANSWER: The maximum life span of Albertosaurus was about 100 years. supported not supported cannot be determined from this graph Part G Is the following statement supported or not supported by the data shown in the graph? The mortality rate of young Albertosaurus dinosaurs was far greater than the mortality rate of old dinosaurs. ANSWER: The mortality rate of young Albertosaurus dinosaurs was far greater than the mortality rate of old dinosaurs. supported not supported cannot be determined from this graph Activity: Human Population Growth Click here to complete this activity. Then answer the questions. Part A Which of these was the first of the major events that stimulated an increase in the size of the human population? ANSWER: Which of these was the first of the major events that stimulated an increase in the size of the human population? the discovery of vaccines the discovery of antibiotics the advent of agriculture the Industrial Revolution the bubonic plague Part B Which of these was the second of the major events that stimulated an increase in the size of the human population? ANSWER: Which of these was the second of the major events that stimulated an increase in the size of the human population? the Industrial Revolution the bubonic plague the advent of agriculture the discovery of vaccines the discovery of antibiotics Part C Which of these was the third of the major events that stimulated an increase in the size of the human population? ANSWER: Which of these was the third of the major events that stimulated an increase in the size of the human population? the discovery of antibiotics the discovery of vaccines and the discovery of antibiotics the discovery of vaccines the advent of agriculture the Industrial Revolution Part D Currently, how large is the worldwide population of humans relative to Earth's carrying capacity for humans? ANSWER: Currently, how large is the worldwide population of humans relative to Earth's carrying capacity for humans? either at or above the carrying capacity There is insufficient information to answer this question. at the carrying capacity above the carrying capacity below the carrying capacity Activity: Analyzing Age-Structure Pyramids Click here to complete this activity. Then answer the questions. Part A Ignoring migration, the age structure of a human population likely to increase in size will have what shape? ANSWER: Ignoring migration, the age structure of a human population likely to increase in size will have what shape? Both a pyramid and a rectangle tapering toward the top result in a population that increases in size. inverted pyramid pyramid Both an inverted pyramid and a rectangle tapering toward the top result in a population that increases in size. a rectangle tapering toward the top Part B Ignoring migration, the age structure of a human population likely to decrease in size will have what shape? ANSWER: Ignoring migration, the age structure of a human population likely to decrease in size will have what shape? a rectangle tapering toward the top Both an inverted pyramid and a rectangle tapering toward the top result in a population that decreases in size. pyramid Both a pyramid and a rectangle tapering toward the top result in a population that decreases in size. inverted pyramid Part C Ignoring migration, the age structure diagram of a human population likely to maintain a relatively stable size will have what shape? ANSWER: Ignoring migration, the age structure diagram of a human population likely to maintain a relatively stable size will have what shape? pyramid inverted pyramid Both a pyramid and a rectangle tapering toward the top result in a population that remains stable in size. Both an inverted pyramid and a rectangle tapering toward the top result in a population that remains stable in size. a rectangle tapering toward the top Interpreting Graphs and Data: Demographic Transitions Can you interpret the graph to answer these questions? Part A What does the left y-axis of the graph represent? ANSWER: What does the left y-axis of the graph represent? time total number of births and deaths total population birth rate or death rate birth rate Part B What does the green graph line represent? ANSWER: What does the green graph line represent? population growth rate total number of individuals in the population death rate birth rate Part C Which stage in the graph shows the greatest overall decline in death rate? ANSWER: Which stage in the graph shows the greatest overall decline in death rate? Stage 1 Stage 2 Stage 3 Stage 4 Part D This question will be shown after you complete previous question(s). Part E This question will be shown after you complete previous question(s). Part F This question will be shown after you complete previous question(s). Part G This question will be shown after you complete previous question(s). Part H This question will be shown after you complete previous question(s). Interpreting Graphs and Data: Comparing Population Age-Structure Graphs These two age-structure pyramids, or population profiles, compare the populations of Canada and Niger, a country in West Africa. Can you interpret these graphs to answer the following questions? Source: United Nations World Population Prospects: The 2010 Revision Population Database Part A Look at the age-structure pyramids. The numbers between the bars (in the middle of the graphs) serve as the y-axis. What do these numbers represent? ANSWER: Look at the age-structure pyramids. The numbers between the bars (in the middle of the graphs) serve as the y-axis. What do these numbers represent? the population of males and females the total population, in millions the number of people born in a particular year the age classes, in 5-year ranges the percentage of the population in each age class Part B What do the bars on the graphs represent? ANSWER: What do the bars on the graphs represent? the number of males and females in each age group the number of males and females born in different years the percentage of males and females in each age group birth rate or death rate for each age group Part C In 2010, how many 25- to 29-year-old women lived in Niger? ANSWER: In 2010, how many 25- to 29-year-old women lived in Niger? about 0.5 million about 1.0 million about 1.2 million about 0.5 billion cannot be determined from the graph Part D The colors of the bars on the graphs indicate the life stage of the people in that age class. What does it mean if a bar is colored blue? ANSWER: The colors of the bars on the graphs indicate the life stage of the people in that age class. What does it mean if a bar is colored blue? The people in that age class are past reproductive age. The answer cannot be determined from the graphs. The people in that age class are of reproductive age. The people in that age class have not yet reached reproductive age. Part E The 2010 age-structure pyramid for Niger indicates that the population of Niger ________. ANSWER: The 2010 age-structure pyramid for Niger indicates that the population of Niger ________. was increasing was stable was decreasing cannot be determined from the graph Part F In Canada in 2010, which age classes contained the largest number of people? ANSWER: In Canada in 2010, which age classes contained the largest number of people? children between 5 and 14 adults between 25 and 34 adults between 35 and 45 adults between 45 and 54 adults between 55 and 64 Part G This question will be shown after you complete previous question(s). Part H This question will be shown after you complete previous question(s). Part I This question will be shown after you complete previous question(s). Interpreting Graphs and Data: Island Biodiversity The equilibrium theory of biogeography states that the number of species on an island is determined by two key factors: the size of the island and its distance from the mainland. The relationship between these factors is illustrated in this graph. Can you interpret the graph to answer these questions? Part A What information is presented on the y-axis? ANSWER: What information is presented on the y-axis? the size of the island the number of species per island the distance from the mainland the rate of immigration or extinction Part B What does the top red graph line represent? ANSWER: What does the top red graph line represent? the rates at which species immigrate and become extinct on an island that is close to the mainland the rate at which species become extinct on a small island the rate at which new species immigrate to an island that is distant from the mainland the rate at which new species immigrate to an island that is close to the mainland Part C What kind of island has the highest rate of extinction? ANSWER: What kind of island has the highest rate of extinction? a small island a large island an island that is close to the mainland an island that is distant from the mainland cannot be determined from the graph Part D On what kind of island would new species be most likely to arrive? ANSWER: On what kind of island would new species be most likely to arrive? a small island a large island an island that is close to the mainland an island that is distant from the mainland cannot be determined from the graph Part E The number of species on an island is at equilibrium when the rate of immigration is equal to the rate of extinction. This is shown on the graph by the points where each green and red line cross. What kind of island is likely to have the highest number of species? ANSWER: What kind of island is likely to have the highest number of species? a small island close to the mainland a small island distant from the mainland a large island close to the mainland a large island distant from the mainland cannot be determined from the graph Part F This question will be shown after you complete previous question(s). Current Events: As Dengue Fever Sweeps India, a Slow Response Stirs Experts' Fears (New York Times, 11/6/2012) Read this New York Times article and then answer the questions. As Dengue Fever Sweeps India, a Slow Response Stirs Experts' (New York Times, 11/07/2012) Registration with The New York Times provides instant access to breaking news with NYTimes.com. To register, go to http://www.nytimes.com/register. Visithttp://www.nytimes.com/content/help/rights/terms/terms-of-service.html to review the current NYT Terms of Service. Part A You are a scientist interested in preventing Dengue fever through vector control. Which of the following are you studying? ANSWER: You are a scientist interested in preventing Dengue fever through vector control. Which of the following are you studying? rats mosquitoes black flies fleas Part B At this time, which of the following would be the most beneficial in controlling the spread of Dengue fever? ANSWER: At this time, which of the following would be the most beneficial in controlling the spread of Dengue fever? Having all infected people take high doses of antibiotics. Having all people in affected areas receive a vaccine. Eliminating all areas of standing water. Requiring restaurants and street vendors to thoroughly clean all of their produce. Part C Which of the following is true? ANSWER: Which of the following is true? Dengue fever is never fatal. Dengue fever is nearly always fatal. Dengue fever is rarely fatal. Dengue fever is fatal in nearly half of all cases. Part D You are an epidemiologist working for the federal agency in charge of monitoring and managing Dengue fever cases in the U.S. Who do you work for? ANSWER: You are an epidemiologist working for the federal agency in charge of monitoring and managing Dengue fever cases in the U.S. Who do you work for? Department of Health and Human Services Department of the Interior Centers for Disease Control Environmental Protection Agency Part E You are a scientist specializing in the organism that causes Dengue fever. What are you? ANSWER: You are a scientist specializing in the organism that causes Dengue fever. What are you? mycologist oncologist virologist bacteriologist GraphIt!: Age Pyramids and Population Growth Click here to complete the graphing activity. Then answer the questions. Part A - Question 1 The population of Greece is expected to _______. You did not open hints for this part. ANSWER: The population of Greece is expected to _______. expand stablize decline Part B - Question 2 Assuming the current trend continues, in 30 years Greece will have more children than reproductive-age individuals. You did not open hints for this part. ANSWER: Assuming the current trend continues, in 30 years Greece will have more children than reproductive-age individuals. True False Part C - Question 3 Assuming the current trend continues, in 30 years Greece will have more children than elderly members of the population. You did not open hints for this part. ANSWER: Assuming the current trend continues, in 30 years Greece will have more children than elderly members of the population. True False Part D - Question 4 Assuming the current trend continues, in 30 years Greece will have more reproductive-age individuals than children. ANSWER: Assuming the current trend continues, in 30 years Greece will have more reproductive-age individuals than children. True False Part E - Question 5 Assuming the current trend continues, in 30 years Greece will have more elderly than reproductive-age individuals. ANSWER: Assuming the current trend continues, in 30 years Greece will have more elderly than reproductive-age individuals. True False Part F - Question 6 Greece had more females than males in 2000. Which of the following is the most likely explanation for this? You did not open hints for this part. ANSWER: Greece had more females than males in 2000. Which of the following is the most likely explanation for this? More females are born than males, and this difference remains throughout all age groups. Females generally have a shorter life span than males. Males generally have a shorter life span than females. There should be an equal number of males and females in every age group, so this is likely an error in the 2000 census for Greece. Part G - Question 7 The population of Colombia is currently _______. You did not open hints for this part. ANSWER: The population of Colombia is currently _______. expanding stable declining Part H - Question 8 Assuming the current trend continues, in 30 years Colombia will have more children than reproductive-age individuals. You did not open hints for this part. ANSWER: Assuming the current trend continues, in 30 years Colombia will have more children than reproductive-age individuals. True False Part I - Question 9 Assuming the current trend continues, in 30 years Colombia will have more children than elderly members of the population. You did not open hints for this part. ANSWER: Assuming the current trend continues, in 30 years Colombia will have more children than elderly members of the population. True False Part J - Question 10 Assuming the current trend continues, in 30 years Colombia will have more reproductive-age individuals than children. ANSWER: Assuming the current trend continues, in 30 years Colombia will have more reproductive-age individuals than children. True False Part K - Question 11 Assuming the current trend continues, in 30 years Colombia will have more elderly than reproductive-age individuals. ANSWER: Assuming the current trend continues, in 30 years Colombia will have more elderly than reproductive-age individuals. True False Building Vocabulary: Biology Terms - Population Ecology Knowing the meaning of common prefixes, suffixes, and word roots can help you understand biology terms. Part A Can you match these biology terms with their definitions? Drag the terms on the left to the appropriate blanks on the right to complete the sentences. Not all terms will be used. ANSWER: Chapter 26 Reading Quiz Question 1 Part A All the living and nonliving components of a defined geographical area comprise a(n) __________. You did not open hints for this part. ANSWER: All the living and nonliving components of a defined geographical area comprise a(n) __________. group population biosphere ecosystem community Chapter 26 Reading Quiz Question 2 Part A What would you name the collection of species of small fish that interact in a pool at the base of a waterfall? You did not open hints for this part. ANSWER: What would you name the collection of species of small fish that interact in a pool at the base of a waterfall? biosphere ecosystem ecology community population Chapter 26 Reading Quiz Question 3 Part A What would be required for a population size within a community to remain stable? You did not open hints for this part. ANSWER: What would be required for a population size within a community to remain stable? Emigration should be larger than immigration. Immigration and emigration should be equal. Immigration should be larger than emigration. Deaths should outnumber births. Births should outnumber deaths. Chapter 26 Reading Quiz Question 4 Part A Which of the following defines biotic potential? You did not open hints for this part. ANSWER: Which of the following defines biotic potential? a measure of how a population grows by a fixed percentage of its size at the beginning of that time period the curbs on population growth that are set by the living and nonliving environment the theoretical maximum rate at which a population could increase a measure of the change in population size per individual per unit of time Chapter 26 Reading Quiz Question 5 Part A Which of the following is an example of environmental resistance? You did not open hints for this part. ANSWER: Which of the following is an example of environmental resistance? an overabundance of food predation symbiosis mutualism Chapter 26 Reading Quiz Question 6 Part A Calculate the annual growth rate of a population of 10,000 with 1,500 births and 500 deaths each year. You did not open hints for this part. ANSWER: Calculate the annual growth rate of a population of 10,000 with 1,500 births and 500 deaths each year. 25% 20% 5% 10% 15% Chapter 26 Reading Quiz Question 7 Part A If you calculate the growth rate as the birth rate minus the death rate, what happens when the death rate exceeds the birth rate? You did not open hints for this part. ANSWER: If you calculate the growth rate as the birth rate minus the death rate, what happens when the death rate exceeds the birth rate? Exponential growth occurs. There will be no change in the growth rate. The growth rate will be positive. The growth rate will be negative. Chapter 26 Reading Quiz Question 8 Part A An exponential growth curve must take deaths into account. How would the shape of the curve be affected as death rates increase? You did not open hints for this part. ANSWER: An exponential growth curve must take deaths into account. How would the shape of the curve be affected as death rates increase? As the death rate increases, the curve retains its J-shape. It would become steeper. The curve flattens out. The curve would become S-shaped. Chapter 26 Reading Quiz Question 9 Part A What is rapid population growth followed by a sudden, massive die-off called? You did not open hints for this part. ANSWER: What is rapid population growth followed by a sudden, massive die-off called? exponential growth logistic population growth growth rate boom-and-bust cycle Chapter 26 Reading Quiz Question 10 Part A What usually happens when an invasive species is introduced into an ecosystem with favorable conditions and little environmental resistance? You did not open hints for this part. ANSWER: What usually happens when an invasive species is introduced into an ecosystem with favorable conditions and little environmental resistance? a boom-and-bust cycle an S-curve growth pattern a population crash exponential growth Chapter 26 Reading Quiz Question 11 Part A Red tides are caused by a single-celled photosynthetic protist. What problem does a boom-and-bust cycle of this organism cause? You did not open hints for this part. ANSWER: Red tides are caused by a single-celled photosynthetic protist. What problem does a boom-and-bust cycle of this organism cause? production of neurotoxins that kill a massive number of fish and sicken people as well damage to coral reefs navigation problems an increase in the nitrogen content of affected waters Chapter 26 Reading Quiz Question 12 Part A Assume you have inoculated a small number of bacterial cells into a supportive culture medium and incubated it while watching for an increase in numbers over time. You found that after a short period, the number of bacterial cells increased rapidly (exponentially). With time, growth slowed and eventually leveled off. How could you explain the leveling off with no additional increase in the bacterial number? You did not open hints for this part. ANSWER: Assume you have inoculated a small number of bacterial cells into a supportive culture medium and incubated it while watching for an increase in numbers over time. You found that after a short period, the number of bacterial cells increased rapidly (exponentially). With time, growth slowed and eventually leveled off. How could you explain the leveling off with no additional increase in the bacterial number? Bacterial cells began mitotic cell division. The environment is damaged by overshooting the carrying capacity. The second wave of the J-curve is reached. Growth reached the carrying capacity of the ecosystem. Chapter 26 Reading Quiz Question 13 Part A Which of the following becomes more important as the population density increases? You did not open hints for this part. ANSWER: Which of the following becomes more important as the population density increases? density-dependent factors, such as nutrients, energy and space pesticides and pollutants climate fire density-independent factors Chapter 26 Reading Quiz Question 14 Part A Why are predators considered to be density-dependent controls on populations? You did not open hints for this part. ANSWER: Why are predators considered to be density-dependent controls on populations? They have a profound effect on local populations, particularly those of small, short-lived species, regardless of their population density. As prey populations grow, predation becomes more important by limiting prey density. They cull prey that are poorly adapted or perhaps weakened by age. They maintain populations of their prey at well below carrying capacity. Chapter 26 Reading Quiz Question 15 Part A What is an example of an adaptation that allows a population of organisms with a life span of more than a year to survive density-independent controls imposed by seasonal changes, such as winter? You did not open hints for this part. ANSWER: What is an example of an adaptation that allows a population of organisms with a life span of more than a year to survive density-independent controls imposed by seasonal changes, such as winter? running faster migration eating green leaves sleeping swimming Chapter 26 Reading Quiz Question 16 Part A Which is a description of an "out-of-phase population cycle of predator and prey"? You did not open hints for this part. ANSWER: Which is a description of an "out-of-phase population cycle of predator and prey"? a result of exceeding carrying capacity a situation where predators exert control over prey a dramatic decline in the prey population, which in turn may result in a decline in the predator population the result of drastic events that reduce the capacity of a region (such as an island) to sustain organisms that cannot emigrate Chapter 26 Reading Quiz Question 17 Part A Consider the recent release of gray wolves into Yellowstone National Park. Elk are primary prey for wolves, so it has been suggested that wolves will significantly reduce the elk population. What will be a consequence of elk reduction? You did not open hints for this part. ANSWER: Consider the recent release of gray wolves into Yellowstone National Park. Elk are primary prey for wolves, so it has been suggested that wolves will significantly reduce the elk population. What will be a consequence of elk reduction? The gray wolf population will then decrease. The balance of predator and prey will be significantly upset to the point that it may not be able to recover. The wolves will experience a population crash because of the lack of food. Other prey, such as deer, will increase in numbers. Chapter 26 Reading Quiz Question 18 Part A A parasite feeds on a larger organism called its _____. You did not open hints for this part. ANSWER: A parasite feeds on a larger organism called its _____. host early-loss population predator pathogen invasive species Chapter 26 Reading Quiz Question 19 Part A What term is used to define the interaction among individuals who attempt to use the same limited resources, which consequently limits population size in a density-dependent manner? You did not open hints for this part. ANSWER: What term is used to define the interaction among individuals who attempt to use the same limited resources, which consequently limits population size in a density-dependent manner? parasitism competition predation immigration survivorship Chapter 26 Reading Quiz Question 20 Part A What is the meaning of intraspecific competition as it relates to competition for resources? You did not open hints for this part. ANSWER: What is the meaning of intraspecific competition as it relates to competition for resources? competition between individuals with a uniform distribution competition among individuals of different species competition between individuals of the same species destruction of the balance between a parasite and its host where the host has no natural defense against the parasite a free-for-all for resources Chapter 26 Reading Quiz Question 21 Part A Which of the following is an example of scramble competition? You did not open hints for this part. ANSWER: Which of the following is an example of scramble competition? Individuals that are poorly adapted, weakened by age, or unable to find adequate food and shelter are culled. Moths lay so many eggs on a tree that the hatched caterpillars strip all the leaves and many die because of lack of food before they can metamorphose into moths. Locust move into new areas for food in response to overcrowding. A plant disease spreads easily through acres of densely planted crops. A songbird defends an area that contains important resources such as food or places to raise its young. Chapter 26 Reading Quiz Question 22 Part A What effect does cutting rain forests for agriculture have on natural populations? You did not open hints for this part. ANSWER: What effect does cutting rain forests for agriculture have on natural populations? Predator populations would increase. It reduces parasitism. It imposes density-independent limitations. Scramble competition would cease. Chapter 26 Reading Quiz Question 23 Part A What type of distribution is demonstrated by cottonwood trees growing along streams and rivers in grasslands? You did not open hints for this part. ANSWER: What type of distribution is demonstrated by cottonwood trees growing along streams and rivers in grasslands? clumped distribution random distribution intraspecific competition uniform distribution Chapter 26 Reading Quiz Question 24 Part A What is the definition of a survivorship table? You did not open hints for this part. ANSWER: What is the definition of a survivorship table? a rare occurrence that results among individuals that do not form social groups a chemical or social interaction between individuals to determine access to important resources a table that tracks groups of organisms born at the same time, following them throughout their lives and recording how many continue to survive in each succeeding year a growth pattern characterized by populations that increase up to the maximum number that their environment can sustain, and then stabilize the results from a study of the changing human population Chapter 26 Reading Quiz Question 25 Part A Which population in regard to survivorship produces large numbers of offspring, which receive little or no care or resources from the parents after they hatch or germinate? You did not open hints for this part. ANSWER: Which population in regard to survivorship produces large numbers of offspring, which receive little or no care or resources from the parents after they hatch or germinate? clumped distribution early-loss populations late-loss populations uniform distribution constant-loss populations Chapter 26 Reading Quiz Question 26 Part A If you were studying and tracking the changing human population, you would be studying which field? You did not open hints for this part. ANSWER: If you were studying and tracking the changing human population, you would be studying which field? demography sociobiology phylogeny genetics restoration ecology Chapter 26 Reading Quiz Question 27 Part A Why is it that humans continue to increase in numbers although they are constantly affected by environmental resistance factors? You did not open hints for this part. ANSWER: Why is it that humans continue to increase in numbers although they are constantly affected by environmental resistance factors? Humans respond to environmental resistance by devising ways to overcome it. Humans evolved a longer life span and therefore more childbearing years. There is not a limited carrying capacity on Earth for humans. Humans have a high drive to reproduce. Chapter 26 Reading Quiz Question 28 Part A What is one factor that enhanced human population growth? You did not open hints for this part. ANSWER: What is one factor that enhanced human population growth? invention of the automobile medical progress commercial fishing enhancements clearing of land for agriculture Chapter 26 Reading Quiz Question 29 Part A At what stage of a demographic transition do birth rates decline? You did not open hints for this part. ANSWER: At what stage of a demographic transition do birth rates decline? industrial stage post-industrial stage transitional stage pre-industrial stage Chapter 26 Reading Quiz Question 30 Part A Which of the following describes an age structure of a human population? You did not open hints for this part. ANSWER: Which of the following describes an age structure of a human population? a diagram that shows age groups on the vertical axis and the numbers of individuals in each age group on the horizontal axis, with males and females shown on opposite sides a pattern showing that the rate of population growth in countries that are now developed has changed over time in reasonably predictable stages a plot showing the number of predators and prey in natural ecosystems a track of groups of individuals born at the same time, following them throughout their lives and recording how many continue to survive in each succeeding year Score Summary: Your score on this assignment is 0.0%. You received 0 out of a possible total of 120 points.
|
|
Comments (0)
|
Post your homework questions and get free online help from our incredible volunteers
|