Transcript
Multiple Sequence Alignments
Profiles and Progressive Alignment
Profiles for families of sequences can be built from MSAs
Profiles
Profile: A table that lists the frequencies of each amino acid in each position of protein sequence.
Frequencies are calculated from a MSA containing a domain of interest
Allows us to identify consensus sequence
Derived scoring scheme allows us to align a new sequence to the profile
Profile can be used in database searches
Find new sequences that match the profile
Profiles also used to compute multiple alignments heuristically
Progressive alignment
Profiles: Position-Specific Scoring Matrix (PSSM)
To compare a sequence to a profile, need to assign a score for each amino acid
The score the profile for amino acid a at position p is
where
f(p,b) = frequency of amino acid b in position p
s(a,b) is the score of (a,b) (from, e.g., BLOSUM or PAM)
Profiles: PSSM
Profiles: Consensus Sequence
A consensus residue C(p) is generated at each position of the profile to aid the display of alignments of target sequences with the profile.
The consensus residue c is the amino acid at p that has the highest score M(p,c).
c is the amino acid most mutationally similar to all the aligned residues of the probe sequences at p, rather than the most common one
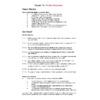
Aligning a sequence to a profile
Scoring a sequence-to-profile alignment
Score each column separately according to PSSM
Each character contributes to score, weighed by its frequency
Profile-to-sequence alignments
Optimum alignment can be found by dynamic programming
Extension of Needleman-Wunsch
Spaces are only added to msa – never removed
Once a gap, always a gap
Can align profiles to profiles
Evolutionary Profiles
Profiles just seen are called average profiles
Generally perform well, but disregard some of the biology
How did each position evolve?
Amount of conservation varies from position to position
Type of conservation varies from position to position
Alternative: Evolutionary profiles
Gribskov, M. and Veretnik, S., Methods in Enzymology 266, 198-212, 1996
Evolutionary Profiles
Idea: Fit a different model at each position
For each position i :
For each possible ancestor b for position i
Try various evolutionary distances x (assume PAM model), and choose the one that minimizes cross entropy
where
fa = observed frequency of a
pa= predicted frequency of a assuming b is the ancestor
and x is the distance
This generates 20 distributions for position i
Evolutionary Profiles
For each position i
Compute “mixture coefficient,” Wai, measuring likelihood that the residue a generated observed distribution (see text)
Profile is given by
where
paij = frequency of residue j in the ancestral residue distribution a at position i
prandom j = frequency of residue j in the database
Progressive multiple alignment
Feng & Doolittle 1987, Higgins and Sharp 1988
Idea: Sequences to be aligned are phylogenetically related
these relationships are used to guide the alignment
Popular implementations: CLUSTALW, PILEUP, T-Coffee
CLUSTALW
Perform pair-wise alignments between all pairs of sequences (n x (n-1)/2 possibilities)
Generate distance matrix.
Distance between a pair = number of mismatched positions in alignment divided by total number of matched positions
Generate a Neighbor-Joining ‘guide tree’ from distance table
Use guide tree to progressively align sequences in pairs from tips to root of tree.
Actually, align profiles
“Once a gap, always a gap”
CLUSTALW
CLUSTALW Tree
CLUSTALW heuristics
Individual weights are assigned to each sequence in a partial alignment in order to downweight similar sequences and up-weight highly divergent ones.
Varying substitution matrices at different alignment stages according to sequence divergence.
Gaps
Positions in early alignments where gaps have been opened receive locally reduced gap penalties
Residue-specific gap penalties and locally reduced gap penalties in hydrophilic regions encourage new gaps in potential loop regions rather than regular secondary structure.
Progressive Alignment: Discussion
Strengths:
Speed
Progression biologically sensible (aligns using a tree)
Weaknesses:
No objective function.
No way of quantifying whether or not the alignment is good
Problems with CLUSTALW
Local minimum problem:
Alignment depends on sequence addition order.
With each alignment some proportion of residues are misaligned
Worse for divergent sequences
Errors get “locked in” and propagate as sequences are added
Can result in arbitrary and incorrect alignments
Clustal uses global alignment … may not be accurate for all parts of the sequence
T-Coffee considers local similarity as well as global
Iterative alignment
To avoid local minima, realign subgroups of sequences and then incorporate them into a growing multiple sequence alignment
Improves overall alignment score.
May involve rebuilding the guide tree
May be randomized
Programs:
MultAlin
PRRP
DIALIGN
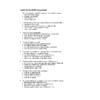
Phylogenetic Alignment
C
A
A
—
G
A
A
A
—
T
A
—
A
C
T
G
—
50%
25%
0%
0%
25%
75%
0%
0%
25%
0%
25%
0%
25%
0%
50%
1
2
3
1
2
3
Note: While profiles can be used for any kind of sequence data, we’ll focus on protein sequences
Gribskov et al. PNAS. 84 (13): 4355 (1987)
Insertion/deletion penalty
K L M – K
K L K L K
K M M L –
M L – L M
.25
.25
.25
.25
.50
.25
.25
.75
.75
.75
.25
.75
K
L
M
-
1
2
3
4
5
K K L - L M
1 - 2 3 4 5
Align with profile:
K K L - L M
K - L M – K
K - L K L K
K - M M L –
M - L – L M
K K L L M
New sequence:
.25
.25
.25
.25
.50
.25
.25
.75
.75
.75
.25
.75
K
L
M
-
1
2
3
4
5
K K L - L M
1 - 2 3 4 5
Column 1 score:
0.75 s(K,K) + 0.25 s(K,M)
Tree calculated from an alignment of more than 1100 ring finger domains, using ClustalW 1.83.
Given a tree for a set of species S, find ancestral species such that total distance is minimized.
CTGG
GTGG
GTGG
CTGG
CCGG
CTAA
GTAA
CTTC